Polymer Gel Based Actuator:
Dynamic model of gel for real time control
by
Woojin Lee
B.S.M.E., Massachusetts Institute of Technology, 1988
M.S.M.E., Massachusetts Institute of Technology, 1990
SUBMITTED TO THE DEPARTMENT OF MECHANICAL ENGINEERING
IN PARTIAL FULFILLMENT OF THE REQUIREMENTS
FOR THE DEGREE OF
DOCTOR OF PHILOSOPHY
AT THE
MASSACHUSETTS INSTITUTE OF TECHNOLOGY
MAY 1996
![]() Massachusetts Institute of Technology 1996
Massachusetts Institute of Technology 1996
Signature of Author: _________________________________________________________
Department of Mechanical Engineering
May 1996
Certified by: ________________________________________________________________
Dr. David L. Brock
Thesis Supervisor
Certified by: ________________________________________________________________
Dr. J. Kenneth Salisbury, Jr.
Thesis Supervisor
Accepted by: _______________________________________________________________
Professor A.A. Sonin
Chairman, Department Graduate Committee
Polymer Gel Based Actuator:
Dynamic model of gel for real time control
by
Woojin Lee
Submitted to the Department of Mechanical Engineering
on May 3, 1996 in Partial Fulfillment of the
Requirements for the Degree of Doctor of Philosophy
Abstract
This thesis explored the potential of polymer gel based actuator as an alternative actuation method by focusing on static/dynamic modeling of actuator system suitable for real-time control implementation. Such model must be simple enough to be implemented in real-time control, yet still able to capture the essential dynamics such as the coupling effect among chemical, electrical and mechanical energy domains of polymer gel. The developed model was tested and verified through computer simulation and experimentation employing the gel based actuator system prototype. The verified model was then incorporated into real-time control of the actuator prototype.
Thesis Supervisor: Dr. David L. Brock
Title: Research Scientist, MIT AI Laboratory
Thesis Supervisor: Dr. J. Kenneth Salisbury, Jr.
Title: Principal Research Scientist, MIT AI Laboratory
Acknowledgments
I would like to thank the members of the Artificial Muscle Laboratory for their support and encouragement. I am grateful to David L. Brock and Ken Salisbury for their continuous support, encouragement and insights.
My O-thu-gi, Meesook devoted tremendous, endless love, and has been patiently waiting for this moment. Meesook and my two kids, Calvin and Jonathan, made this process more than enjoyable, and they have never failed to put smile back on my face whenever things were going tough. Thanks for having faith in me.
Thanks also to my grandmother, parents and my brothers for their continuous love, patience, encouragement and support. My grandmother, mom and dad always believed in me, and my two brothers were always there for me. Words cannot describe how much I'm grateful.
Special thanks goes to my parents, sisters and brother in law. Their day-to-day support made this long journey possible, and without them, we would not be where we are today. Thank you.
Lastly, I would like to thank God for giving me everything I have.
TABLE OF CONTENTS
Abstract 2
Acknowledgments 3
Table of Contents 4
List of Symbols 6
Chapter
1 Introduction 8
1.1 Motivation 8
1.2 Polymer Gel Actuation 9
1.3 Objective 10
2 Background 12
3 Dynamic Model of Polymer Gel for Control System 16
3.1 Introduction 16
3.2 Dynamic Model of Non-Electrolyte Gel 20
3.2.1 Mixing/diffusion process: Flory's model 22
3.2.2 Rubber elasticity: Flory's model (statistical thermodynamics) 27
3.2.3 Rubber elasticity: simple mechanical model 30
3.2.4 Overall process: mixing/diffusion and deformation 35
3.2.5 Polymer gel swelling kinetics 35
3.3 Dynamic Model of Electrolyte Gel 39
3.3.1 Equilibrium conditions 39
3.3.2 Chemical capacitance model 43
3.3.3 Electric potential capacitance model 44
3.3.4 Kinetic model 49
3.3.5 Ion diffusion limited reaction 53
3.3.5 Overall ion transport process: binary solution case 60
3.3.6 Ionic contribution and electrolyte gel swelling 65
4 Model Verification 69
4.1 PVA-PAA in Acetate Buffer Solution 69
4.1.1 Acetate buffer chemistry 70
4.1.2 PVA-PAA gel preparation 75
4.2 Equilibrium swelling model verification 75
4.2.1 Equilibrium swelling model 75
4.2.2 Experimental procedure 77
4.2.3 Experimental result 78
4.2.4 Model parameter estimation 82
4.2.5 Model result 84
4.2.6 Discussion 92
4.3 Swelling kinetics model verification 96
4.3.1 Limiting process identification procedure 97
4.3.2 Experimental result 100
4.3.3 PVA-PAA gel dynamic model 101
4.3.4 Model simulation and discussion 104
5 Implementation 111
5.1 Demonstration actuator device 111
5.2 Results 113
6 Conclusion 117
6.1 Review 117
6.2 Contributions 123
6.3 Future 123
Appendix
A Actuator system design 126
B PAN fiber mechanical testing 140
References 148
LIST OF SYMBOLS
To ambient temperature
Po ambient pressure
Ucv internal energy of control volume
Scv entropy of control volume
Vcv volume of control volume
Fx uniaxial tensile force
L elongation
![]() chemical potential of polymer
chemical potential of polymer
![]() chemical potential of solvent
chemical potential of solvent
np number of moles of polymer inside the control volume
ns number of moles of solvent inside the control volume
Gcv1 Gibbs free energy of control volume at state 1
Gcv2 Gibbs free energy of control volume at state 2
Gso standard Gibbs free energy of solvent
Gpo standard Gibbs free energy of polymer
![]() change in Gibbs free energy of control volume due to mixing
change in Gibbs free energy of control volume due to mixing
Scv1 entropy of control volume at state 1
Scv2 entropy of control volume at state 2
Sso standard entropy of solvent
Spo standard entropy of polymer
![]() change in entropy of control volume due to mixing
change in entropy of control volume due to mixing
R universal gas constant
![]() is the volume fraction of solvent,
is the volume fraction of solvent,
![]() is the volume fraction of polymer, and
is the volume fraction of polymer, and
s is the number of chain segments of a polymer molecule such that the volume of a polymer molecule is equal to s time the volume of a solvent molecule, i.e., molar volume of polymer = s times molar volume of solvent
![]() Flory-Huggins polymer-solvent interaction parameter
Flory-Huggins polymer-solvent interaction parameter
![]() change in Gibbs free energy of control volume due to elastic deformation
change in Gibbs free energy of control volume due to elastic deformation
![]() change in entropy of control volume due to elastic deformation
change in entropy of control volume due to elastic deformation
k Boltzmann's constant
![]() effective number of chains in the gel
effective number of chains in the gel
![]() elongation factor (length / dry length) in x-axis
elongation factor (length / dry length) in x-axis
![]() elongation factor in y-axis
elongation factor in y-axis
![]() elongation factor in z-axis
elongation factor in z-axis
Lo,s swollen, unstretched length of gel
Lo dry length of gel
ei
normal axial strains in i-axis (i= x, y, z)si
normal axial stress in i-axisE elastic modulus of elastomer
n
Poissonís ratio (or "Poisson-like" ratio in the context of simple mechanical model of rubber elasticityLido dry, stress-free gel of linear dimension in i-axis
Li isotropically swollen and stretched dimension in i-axis
Aid cross sectional area of deformed elastomer unit aligned in i-axis
a
i elongation factors in i-axisvso molar volume of pure solvent
Pm permeability factor of the solvent in polymer gel network
U macro-scale "superficial velocity", defined as the flow rate Q divided by the total (solid plus fluid) cross-sectional area
Km permeability in the context of Darcy's law
m
vis solventís fluid dynamic viscosityD
z gelís characteristic thickness solvent travels during swellinga radius of the fiber in Happel and Brenner's model
b fluid envelope radius in Happel and Brenner's model
m
i,e electrochemical potential of ion ixi,g mole fraction of ion i
zi valence of ion i
f
i,g electrical potential of the ion i inside the gelF Faraday constant, 9.648 x 10⁴ coul/mol
CE,i electric potential coupling capacitance
![]() dielectric constant of the electrolyte
dielectric constant of the electrolyte
d typical maximum separation of charges in a volume element, ~ 10-10 m
qi charge of the ion [coul]
CE,i bulk electroneutrality potential capacitance of ion species i
r
u total net charge![]()
Di diffusion coefficient [m2/sec]
ci concentration [mol/m3]
ui mobility [m2/volt*sec]
kf forward reaction constant
kr reverse reaction constant
Keq reaction's equilibrium constant
t
process time constantKa acid ionization constant of acetic acid
Chapter 1
Introduction
1.1 Motivation
The electric motor is the primary actuator used in numerous applications ranging from household appliances to robotics. However, in the fields of robotics, its high weight, limited sizes, complex transmissions and restrictive shapes have constrained the design and development of robotic systems. Although improvements in volume to weight ratio, clever transmissions, and alternatives such as pneumatics and hydraulics are being developed, actuators remain the fundamental constraint on robot performance. Nitinol, a shape memory alloy, has also been used in robotics, however the thermal to mechanical energy conversion has proven difficult in practical applications.
Over the last 10 years there has been a great deal of effort directed toward developing more dexterous robots (Salisbury 1984, Jacobsen 1986, Hess 1989) and master controllers (Bejczy and Salisbury, 1984, Agronin, 1987, Jacobsen 1989 and Iwata, 1990) capable of permitting human control of these complex devices. In the development of these systems a great deal of effort was spent in developing the mechanism of getting power to the individual finger joints and in making the system as light as possible so that the limited power available was not wasted on supporting the structure. The robot hand most similar to the human geometry, the UTAH/MIT hand, has a "remotizer" which consists of numerous pulleys (nearly 400) and tendons filling approximately a 12" by 4" by 3" area. This remotizer allows the pneumatic cylinders to be tightly packed in a remote location as it was not possible to locate them at the individual joints. It unfortunately makes integration of this device into a robot with a full range of motion at the wrist difficult. The Salisbury design has fewer degrees of freedom and uses steel cables routed inside sheaths around the wrist area. This device is more practical, but has higher friction and lower bandwidth. Others also tried placing the actuators in the base of the palm with fewer degrees of freedom, making the device easy to integrate with other robots while sacrificing bandwidth and backdrivability.
All of these groups were working around a fundamental limitation in today's actuator technology. Actuators small and strong enough to be placed proximal to the joint, as muscles are in the human system, were not available. What would be ideal for robotic actuation and rehabilitation devices would be an analog of a human muscle --- a contractile compliant "artificial muscle" material driven by chemical, thermal or electrical signals. In addition to direct applicability to robotics and rehabilitation, such material may be useful in producing smaller valves, bio-compatible end effectors for laparoscopic and arthroscopic surgery, and effective tactile displays. Recent research in polymer gels offers the hope for such an "artificial muscle" and a potential revolution in actuator design.
1.2 Polymer Gel Actuation
The polymer gel can swell or shrink considerably in response to various external stimuli such as temperature, pH, electric fields, or solvent. It has been suggested that these gels could be used as the basis for a compliant actuator or "artificial muscle". Recent research on polymer gel has made actuation based on this technology more practical. First, much research on gel based actuation has focused on the material itself, hence the physics of gel contraction has become well understood. Second, a number of innovations have made gel based actuation much more practical. For instance, thin films and fine fibers have been fabricated, allowing faster contraction rates and higher strength (Chiarelli, 1989). Finally, technological innovations such as robotics and implantable artificial biological organs have created a demand for such devices.
1.3 Objective
The design of a practical polymer gel actuator requires consideration not only of the material, but also the supporting mechanics, stimulation method, energy storage system, energy efficiency, power delivery technique, packaging method, static/dynamic model, and control system. Among these issues, availability of a simple thermodynamically correct static/dynamic model of gel/support system greatly enhances the investigations of the rest of the issues such as the stimulation method, energy efficiency, power delivery technique, etc. In addition, such a simplified model is integral to a real-time control system implementation. Therefore, I have chosen the development of a simplified model of polymer gel based actuator system suitable for real-time control as the objective.
The objective of this thesis was to develop a lumped parameter model of a gel based actuator for real-time control. The research consisted of three parts: (1) model development, (2) experimental model verification, and (3) application of the dynamic model using a real-time control system. A prototype actuator was constructed based on pH stimulated poly(vinyl Alcohol)-poly(acrylic acid) (PVA-PAA) gel since its swelling behavior is continuous with minimum hysteresis. The model was experimentally verified, and once verified, it was incorporated into real-time control system of prototype actuator system.
Chapter 2
Background
Previous work by researchers in the area of polymer gel largely fall into three categories: (1) gel fabrication and characterization, (2) theoretical modeling of swelling behavior, and (3) application (primarily drug delivery systems.) Mainly due to the limitation of the available material, much of the research on gel based actuation has focused on material fabrication and characterization, including studies of the mechanical properties (Chiarelli, 1988; Suzuki, 1991). Recent development in polymer gel fabrication have produced thinner and stronger gel fibers. For example, a gel based actuator formed by bundling 25mm diameter poly(acrylonitrile)-polypyrrole (PAN-PPY) and poly(vinylalchohol) (PVA) fibers was constructed, and demonstrated contraction rates on the order of a second and a force up to 100 N/cm2 (Chiarelli, 1989). At Hokkaido University in Japan, an electrically-driven chemomechanical poly(2-acrylamido-2-methylpropanesulfonic acid) (PAMPS) polymer gel sheet was fabricated which produced swinging motion under alternating 10V electric field. This actuation's response time was on the order of 2 seconds (Okuzaki and Osada, 1994).
The theoretical modeling of gel's swelling behavior mainly consist of equilibrium swelling volume studies and electromechanochemical kinetic studies. Much of the work in the area of equilibrium swelling volume study (Hirotsu, et. al., 1987; Li and Tanaka, 1989) are largely based on the pioneering work by Flory (Flory, 1953). In the area of gel kinetics, the need to predict the dynamic behavior for applications such as the drug delivery and the gel based actuation stimulated recent researchers (Tanaka and Fillmore, 1979; Matsuo, 1988; Grimshaw, et. al., 1990; Gehrke, et al, 1992; Segalman, et. al., 1994).
With the availability of promising materials, interest in polymer gel based actuator has increased. A number of contractile gel devices have already been constructed, including a robot gripper (Caldwell, 1989), multifingered hand (Kurauchi, et. al., 1991), artificial fish (Kurauchi, et. al., 1991), artificial urethral sphincter (Chiarelli, 1989), and artificial muscle (Brock, 1991; Brock, Lee, Segalman, Witkowski, 1994; Shahinpoor and Mojarrad, 1994). While these devices successfully demonstrated the feasibility of polymer gel based actuation, they have not yet fully addressed the engineering design and control issues necessary for these devices to be practical.

Figure 2.1: A force generating element, an artificial urethral sphincter and a robot gripper are some of the mechanical devices constructed from contractile polymer gel.
The following tables summarize some of the published research on developing polymer gels.
pH
|
Kuhn 1950: pH artificial muscle (PAA) |
|
DeRossi 1986: Isotonic and isometric force measurement (PVA-PAA) |
|
Chiarelli 1989: Artificial Urethral Sphincter (PAN) (PAN-PPY) |
|
Grimshaw 1989, 90: Dynamic membranes, selective macromolecular transport |
Electric Field
|
Hamlem 1965: Contractile gel fiber (PVA-PAA) |
|
Tanaka 1982: Gel cylinders (PAM) |
|
Chiarelli 1988, 89, Osada 1985: Gel disks and strips (PVA-PAA) |
|
DeRossi 1986: Gel strips (PVA-PAA) |
|
Grimshaw, et. al. 1990: Kinetics of gel strips (PMAA) |
|
Ozuki and Osada 1994: Gel sheet (PAMPS) |
Temperature
|
Tanaka 1978, 80, 81: N-isopropylacrylamide (NIPA) |
|
Ilavsky 1982: N-isopropylacrylamide (NIPA) |
|
Hirotsu 1987: N-isopropylacrylamide (NIPA) |
|
Matsuo 1988: Kinetics of contraction/dilation of N-IPA gel spheres (NIPA) |
Solvents
Sodium Acrylate
|
Tanaka 1987: Surface patterns on gel spheres (PAM) |
|
Nagasaws 1988: Surface patterns on gel spheres (PAM) |
Acetone/Water
|
Hrouz 1981: Anionic gels: Diethylacrylamide-sodium methacrylate copolymer) |
|
Ilavsky 1982: Anionic gels: Diethylacrylamide-sodium methacrylate copolymer) |
|
Nicoli 1983: Role of ionized groups on (PAM) |
|
Katayama 1985: Cationic gels -- Acrylamide, trimethyl(N-acryloyl-3-aminopro, N,N'-methylenebisacrylamide copolymer |
|
Caldwell 1990: Servo controlled gripper |
Salt
|
Ohmine 1982: Salt concentrations |
Light
|
Mamada 1990: Ultraviolet light ionizes gel and creates osmotic pressure |
|
Tanaka 1990: Visible light directly heats the polymer network inducing phase transition (NIPA/Ch) |
Enzymes
|
Kokufata 1991: Lectin filled gel (Concanavalin A) responses to saccharide: Saccharide dextran sulfate - dilation Methyl-D-manopyranoside - contraction (NIPA/Lectin) |
Definitions::
PAA Poly(acrylic Acid)
PVA-PAA Poly(vinyl Alcohol) Poly(acrylic Acid)
PAN Poly(acrylonitrile)
PAN/PPY Poly(acrylonitrile) Poly(pyrrole)
PAM Poly(acrylamide)
PAMPS Poly(2-acrylamido-2-methylpropanesulfonic acid)
NIPA N-isopropylacrylamide
Chapter 3
Dynamic Model of Polymer Gel for Control System
3.1 Introduction
In order for an actuator to be practical, its behavior must be predictable and controllable. In both cases, a quantitative static/dynamic model of the actuator is essential, and this model should be simple enough for the real-time control system implementation. In other words, the lumped parameter dynamic model, on the contrary to the continuum model, of both the gel and the support systems are necessary. Even though many researchers have investigated the equilibrium swelling behavior (Flory, 1953; Tanaka, 1981; Vasheghani-Farahani, et. al., 1990) and continuum kinetics of polymer gel (Grimshaw, et. al., 1980; Li and Tanaka, 1991; Quinn and Grodzinsky, 1993; Segalman, et. al., 1994), a dynamic model which is simple enough to be incorporated into the control system, yet able to capture essential dynamics was not yet available. Most of the gel kinetics researches as mentioned above were primarily motivated by applications such as the drug delivery and the selective macromolecular transports where both the detailed spatial and temporal descriptions of gel/membrane's state are essential. Subsequently, kinetic models of gel swelling developed so far were mainly based on the macroscopic continuum description. On the other hand, for applications such as the gel actuation, not only the detailed spatial description offered by the continuum approach is often unnecessary, the complexity of continuum model would be simply much too high to be useful as a simple design or real-time control model. In fact, in designing practical actuation devices, it would be often desirable to treat the gel as a uniform bulk unit with average values of gel's state properties, thereby neglecting the spatial variations all together for simplicity, and only the temporal description of gel's swelling behavior would then be of concern.
In addition, most of the previous models treated the equilibrium behavior and kinetics separately (Quinn and Grodzinsky (1993) investigated the relationship between the gel swelling kinetics and the gel's longitudinal modulus in the context of a poroelastic theory, thereby relating the swelling kinetics to the equilibrium swelling to some extent. However, tight integration of swelling kinetics and the equilibrium state was still not offered.), and therefore did not sufficiently address the electro-chemo-mechanical coupling effects of gel's static/dynamic behavior. Researchers such as Genuini, et. al. (1990) have proposed a lumped parameter model where a diffusion-reaction process was simplified as a time delay process and the mechanical readjustment process was simplified as a standard linear viscoelastic solid. The parameters of the mechanical readjustment process were somewhat artificially related to the free swelling volume of the gel at the given pH. Also, the possible effect of external mechanical forces on the gel's swelling behavior was not mentioned.
Polymer gel actuation involves interactions among multiple energy domains -- electrical, chemical and mechanical -- thus an energy based unified approach to dynamic modeling was appropriate. In this thesis, we employed the bond graph (network thermodynamic) formalism (Paynter, 1961, 1981; Oster, Perelson and Katchalsky, 1973) to aid us in developing the gel model. In the bond graph approach, each subunit of the gel was modeled as a multiport capacitance with ports to multiple energy domains which experiences quasistatic changes where the equilibrium states were defined by modified Flory's equilibrium swelling model. The subunits were then linked to each other by mechanical transmissions and the ions/solvent diffusion processes. Not only did this approach correctly account for the coupling effect between the chemical and the mechanical energy domains, but the topological layout and connectivity of the bond graph model components enhance the intuition of gel actuation dynamics. Dividing the gel structure into many fine subunits should yield results equivalent to the finite difference method, and thus may be used for checking validity. However, it is worthwhile to reemphasize that, in strict sense, the lumped parameter model of polymer gel as presented in this thesis is valid only in the case where the spatial variations of gel's properties can be safely ignored. As the gel's dimension increases, the prediction based on simple few subunits model would increasingly deviate from the actual behavior as well, and in such case, finer division of the gel system into more subunits would be necessary to capture the spatial variations. As with lumped parameter modeling of any system, one should proceed with caution before applying the model as presented in this thesis blindly.
In the following sections, the bond graph based lumped parameter models of both non-electrolyte and electrolyte gel are described. According to Flory, the swelling of gel can be viewed as the result of the reduction of interstitial solvent's chemical potential where the gel's swelling process is driven by the solvent's chemical potential gradient across the gel and bath boundary. The forces influencing the solvent's chemical potential can be largely categorized into three effects; mixing of polymer and solvent, elastic deformation of the polymer network, and the mixing with the mobile ion constituents. Assuming that the gel solution is sufficiently diluted, Flory treated these three contributions to be additive. In the case of non-electrolyte gel such as poly(vinyl) alcohol (PVA), only the first two effects are relevant since non-electrolyte gel's polymer network lacks fixed ionic groups necessary to interact with mobile ion constituents. In the case with electrolyte gel, the non-electrolyte gel model can be simply extended by adding the mobile ions mixing effect. Adopting the Flory's model on gel's swelling, I have first developed the lumped parameter model of non-electrolyte gel based on the quasistatic assumption, and then it was extended to the electrolyte gel case by adding the effect of the mobile ions' mixing.
In the development of the lumped parameter model of non-electrolyte gel, the fundamental modeling assumption employed were that the gel's swelling process is relatively slow, solvent diffusion-limited, isothermal, isobaric and quasistatic, and the mixing/diffusion effect has been modeled after the Flory's work. Although the theory of rubber elasticity of swelling gel has already been developed by Flory based on complex statistical theory, due to its complexity and difficulty in use, I have developed an alternative elasticity model based on simple mechanical analog. The resulting model of non-electrolyte gel was then extended to arrive at the lumped parameter model of electrolyte gel where the states of interstitial mobile ions and polymer network's fixed charge groups were determined by electrical and chemical effects such as the Donnan partition, bulk electroneutrality and diffusion-limited reactions.
The electrolyte gel model was then applied to the case of poly(vinyl Alcohol)-poly(acrylic acid) (PVA-PAA) gel in acetate buffer solution case where the kinetics limiting process has been identified in order to further simplify the complexity of the model. The equilibrium and kinetics predictions of the simplified model was then experimentally verified, and as a demonstration, the model was incorporated into a real-time control system of prototype actuator system.
3.2 Dynamic Model of Non-Electrolyte Gel
Consider the polymer gel network and solvent system inside a control volume (c.v.) as shown in Figure 3.1. The control volume changes as the gel network absorbs the surrounding solvent fluid. The modeling assumptions were: (1) relatively slow process, (2) solvent diffusion-limited, (3) inertial and convection effects negligible, (4) quasistatic (i.e., the properties inside the c.v. are uniform at any instant of time), (5) isothermal, (6) isobaric, (7) two sub-processes (mixing/diffusion and elastic expansion of the polymer-solvent), and (8) polymer and solvent incompressible. The c.v. is assumed to be surrounded by the solvent fluid at constant temperature, To, and constant pressure, Po. As the solvent fluid enters the c.v., the c.v. expands, and the state of the system inside the control volume at an instant of time can be thermodynamically described by
![]()
where Ucv is the internal energy,
Scv is the entropy,
Vcv is the volume,

Figure 3.1: Control volume for non-electrolyte gel model. As the gel's volume changes by either contracting or swelling, the control volume is changed together with the gel's surface.
To is the ambient temperature,
Po is the ambient pressure,
F is the uniaxial tensile force,
L is the elongation,
![]() is the chemical potential of polymer,
is the chemical potential of polymer,
![]() is the chemical potential of solvent,
is the chemical potential of solvent,
np is the number of moles of polymer, and
ns is the number of moles of solvent inside the control volume.
Since the amount of polymer inside the c.v. is fixed, ![]() . In addition, PodVcv, represented the differential expansion work done by the control volume. Assuming both the polymer and the solvent to be incompressible, PodVcv = 0 since the expansion of c.v. alone was exactly canceled by the flow work done by the solvent flowing into the c.v.. The above expression then simplifies to
. In addition, PodVcv, represented the differential expansion work done by the control volume. Assuming both the polymer and the solvent to be incompressible, PodVcv = 0 since the expansion of c.v. alone was exactly canceled by the flow work done by the solvent flowing into the c.v.. The above expression then simplifies to
![]() .
.
With the assumption of a quasistatic process, the system inside the control volume was treated as a lumped parameter multiport capacitance field with the relation
![]() .
.
The first term on the right hand side (RHS) represented the effects of heat transfer and entropy transfer due to convection and the entropy generation due to irreversibility. The second term on RHS represented the chemical energy brought in by the incoming surrounding solvent, and the last term represented the effect of mechanical work on the gel. In Figure 3.2, the gel was represented as a multiport capacitance with three energy ports corresponding to thermal, chemical and mechanical interactions respectively. Constitutive relations describing the polymer-solvent gel network system have been derived by Flory, and were the base of our multiport capacitance model.

Figure 3.2: Bond graph representation of non-electrolyte gel. The gel is represented as a multiport capacitance with three energy ports corresponding to thermal, chemical and mechanical interactions.
3.2.1 Mixing/diffusion process: Floryís model
In state 1 of Figure 3.3, pure polymer network and pure solvent inside the control volume (c.v.) are completely separated whereas in state 2, polymer network and solvent inside the control volume mix and form homogeneous polymer solution, while maintaining constant volume of c.v. The process from state 1 to state 2 is therefore entropy generating run-down mixing process, and the changes in thermodynamic properties of control volume due to such mixing process are described by Flory.
Change in Gibbs free energy of control volume due to mixing, ![]() , may be defined as
, may be defined as
![]()

Figure 3.3: Illustration of entropy generating mixing process. In state 1, pure polymer network and pure solvent inside the control volume are completely separated whereas in state 2, they mix and form a homogeneous solution, while maintaining constant volume.
where Gcv1 is the Gibbs free energy of c.v. at state 1,
Gcv2 is the Gibbs free energy of c.v. at state 2,
Gso is the standard Gibbs free energy of solvent,
Gpo is the standard Gibbs free energy of polymer.
Similarly, change in entropy of control volume due to mixing, ![]() , may be defined as
, may be defined as
![]()
where Scv1 is the entropy of c.v. at state 1,
Scv2 is the entropy of c.v. at state 2,
Sso is the standard entropy of solvent,
Spo is the standard entropy of polymer.
According to Flory, the Gibbs free energy change due to mixing of polymer and solvent is considered to be of two effects; combinatorial effect and polymer-solvent contact effect. The combinatorial effect accounts for the many different conformations the amorphous polymer may adopt, and the polymer-solvent contact effect accounts for the effects of non-randomness induced by intermolecular interactions. The combinatorial effects on entropy and Gibbs free energy are
![]()
![]()
![]()
![]()
where R is the universal gas constant,
ns is the molar quantity of solvent,
np is the molar quantity of polymer,
![]() is the volume fraction of solvent,
is the volume fraction of solvent,
![]() is the volume fraction of polymer, and
is the volume fraction of polymer, and
s is the number of chain segments of a polymer molecule such that the volume of a polymer molecule is equal to s time the volume of a solvent molecule, i.e., molar volume of polymer = s times molar volume of solvent.
The polymer-solvent contact effect involves enthalpy change, and its effect on Gibbs free energy is
![]()
where ![]() is the Flory-Huggins polymer-solvent interaction parameter.
is the Flory-Huggins polymer-solvent interaction parameter. ![]() is a temperature dependent dimensionless quantity which characterizes polymer-solvent interactions, and can also be expressed in form
is a temperature dependent dimensionless quantity which characterizes polymer-solvent interactions, and can also be expressed in form
![]()
where a and b are temperature independent quantities. ![]() can be then written as
can be then written as
![]()
Since

we then have
![]()
It is interesting to note that ![]() represents the thermal energy generated due to the mixing process, and thus can be modeled as the heat transferred to the isothermal surrounding solvent environment.
represents the thermal energy generated due to the mixing process, and thus can be modeled as the heat transferred to the isothermal surrounding solvent environment.
Combining both the combinatorial and polymer-solvent contact effects, we have
![]()
![]()
![]()
For quasistatic mixing/diffusion process, the rate of change of ![]() with respect to time can be modeled as
with respect to time can be modeled as
![]()
and furthermore, the rate of change of ![]() may be expressed as
may be expressed as

With the assumptions of isothermal and isobaric conditions, the quasistatic mixing/diffusion process implies

and the above expressions simplify to
![]()
Since the entropy and Gibbs free energy of gel system inside the control volume are defined as
![]()
where ![]() are constant during the process, the rate of change of Scv, and Gcv with respect to time are
are constant during the process, the rate of change of Scv, and Gcv with respect to time are
![]()
Combining the above results, we then arrived at
![]()
This process can be graphically represented by a simple bond graph structure as shown in Figure 3.4. The entropy generating mixing/diffusion process is modeled by a resistance field driven by solventís chemical potential difference across the gelís control volume boundary, and the total entropy change of control volume is sum of the entropy generated and the entropy transferred by the heat/mass transfer processes.
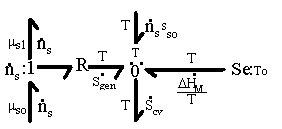
Figure 3.4: Bond graph representation of entropy generating mixing/diffusion process. The resistance field models the mixing/diffusion process driven by solvent's chemical potential difference across the gel's control volume boundary. The total entropy change is sum of the entropy generation and entropy transfer.
3.2.2 Rubber elasticity: Floryís model (statistical thermodynamics)
In addition to the mixing model, Flory also developed a model for the rubber elasticity effect of polymer gel, and extensive research has followed upon his work. Here we will briefly describe his model, and investigate how his model can fit into a lumped parameter frame work.
According to Flory's work, deformation of polymer gel network may be modeled as a two step processes; first, expansion due to free swelling and second, stretching at constant volume without changing the enthalpy of the gel system. Based on the statistical theory of rubber elasticity where the end-to-end distances of the polymer chains is described by the Gaussian distribution, the enthalpy change due to the deformation is assumed to be negligible, and the Gibb's free energy change, ![]() , and the entropy change,
, and the entropy change, ![]() , are described by
, are described by
![]()
![]()
where k is the Boltzmann's constant,
![]() is the effective number of chains in the gel,
is the effective number of chains in the gel,
![]() represents the elongation factor (length / dry length) in x-axis,
represents the elongation factor (length / dry length) in x-axis,
![]() represents the elongation factor in y-axis,
represents the elongation factor in y-axis,
![]() represents the elongation factor in z-axis.
represents the elongation factor in z-axis.
Flory assumed that the polymer network formed at volume Vp is subsequently swollen isotropically by a diluent to a volume V such that the volume fraction of polymer is ![]() . In the subsequent deformation due to stretching, the volume is assumed to stay constant. Letting
. In the subsequent deformation due to stretching, the volume is assumed to stay constant. Letting ![]() ,
, ![]() , and
, and ![]() represent the changes in dimensions resulting from the combination of swelling and elongation,
represent the changes in dimensions resulting from the combination of swelling and elongation, ![]() is therefore constant during the elongation. Considering only a simple elongation in the x-direction, let
is therefore constant during the elongation. Considering only a simple elongation in the x-direction, let ![]() represent the length in this direction relative to the swollen, unstretched length Lo,s = (V/Vo)1/3 Lo. Since the swelling is isotropic,
represent the length in this direction relative to the swollen, unstretched length Lo,s = (V/Vo)1/3 Lo. Since the swelling is isotropic,
![]()
Then

![]()
Substituting the above results, Flory then arrived at

For the deformation process during swelling and stretching, Flory assumed the heat of deformation ![]() to be negligible, and therefore the Gibbs free energy change due to elastic deformation according to Flory is
to be negligible, and therefore the Gibbs free energy change due to elastic deformation according to Flory is

With the constant temperature and pressure assumption, ![]() , which is equal to the deformation work input, is a function of the solvent quantity in the c.v. and the elongation only, i.e.,
, which is equal to the deformation work input, is a function of the solvent quantity in the c.v. and the elongation only, i.e., ![]() . In addition, according to the statistical thermodynamic theory of rubber elasticity, the change in internal energy of elastomer due to the deformation is small. Thus, for constant volume deformation process, we have
. In addition, according to the statistical thermodynamic theory of rubber elasticity, the change in internal energy of elastomer due to the deformation is small. Thus, for constant volume deformation process, we have
![]()
![]()

where F and Lx are tensile force and length in x-axis.
Taking the above results by Flory, the quasistatic description of the process can be represented as

where

This further simplifies to
![]()
and
![]()
which are now in lumped parameterized form.
3.2.3 Rubber elasticity: simple mechanical model
The above theory on rubber elasticity of swelling gel has been developed by Flory based on complex statistical theory which remarkably relates how the molecular structure of elastomer responds to an applied strain to the macroscopic deformation behavior. However, this theory still offers only a qualitative approximation to the actual behavior of elastomer, mainly due to the assumption that end-to-end distances of the chains can be described by the Gaussian distribution (Young and Lovell). In addition, parameters such as effective number of chains in the gel are difficult to obtain. Given the complexity of the statistical model, the purpose of this section is to approximate the gel's elastic behavior with a simpler mechanical analog.
Letís start our analysis with general equations of elasticity for the case with normal stresses only;
![]()
![]()
![]()
where ei is normal axial strains in i-axis (i= x, y, z),
si is normal axial stress in i-axis,
E is elastic modulus of elastomer, and
n is Poissonís ratio.
(Note the orientation independent common values of E and n for all three axes implies that the material is homogeneous and isotropic.) First, we need to define our control volume, whether it should be just the elastomer or the whole gel containing both the elastomer and solvent. In the case where the whole gel is the system, the above relations may take rather simple forms since the osmotic pressure (swelling pressure) can directly replace the axial stresses, and the strains are proportional to length changes. In addition, the applied stress in x-axis is simply the force divided by the cross-sectional area facing x-axis. However, in this approach, the material changes continuously as the gel undergoes swelling along with its system parameters. Although this approach may be appropriate for analysis of small differential swelling effect, it seems more suitable to take the "elastomer only" approach for analysis of finite large swelling effect.
Consider a dry, stress-free gel of linear dimensions Lxdo, Lydo and Lzdo, isotropically swollen and stretched to dimensions Lx, Ly and Lz as shown in Figure 3.5. Assume the elastomer is made up of elastomer units aligned in principal axes, x, y, z, and its volume, Vp, is assumed to be constant. Assuming the volume occupied by the intersecting joint region of elastomer units is relatively small, the constant elastomer volume assumption may be expressed as
![]()
where Aid is cross-sectional area of deformed elastomer unit aligned in i-axis. Since
Vp = AxdoLxdo = AydoLydo = AzdoLzdo
above expression may also be written as
![]()
In addition, define the elongation factors ax, ay and az such that ax = Lx/Lxdo, ay = Ly/Lydo, az = Lz/Lzdo. Furthermore, it has been observed with actual gel under uniaxial tensions that ax does not vary significantly from ay and az. Therefore, we approximated the length ratios and the cross-sectional area ratios in all three axes to be similar in magnitudes, i.e.,

Substituting this to the previous expression, we arrived at
![]() and
and ![]() (i=x,y,z)
(i=x,y,z)
where Ai is cross-sectional area of deformed gel in i-axis. (Note that the deformed elastomer unitsí lengths are also equal to the linear dimensions of the polymer gel as well.) The normal
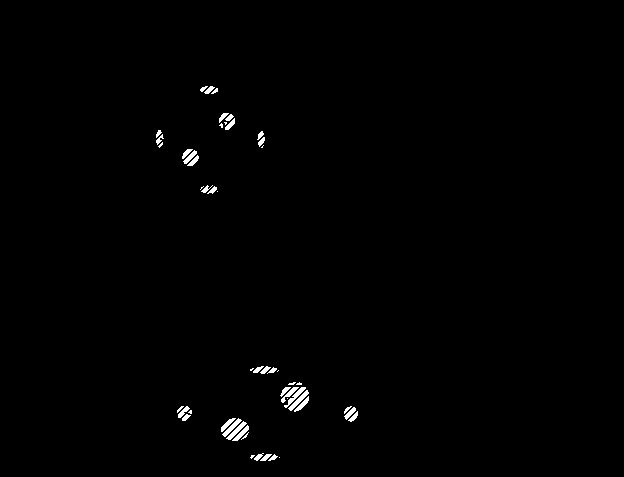
Figure 3.5: Simple mechanical model of gel's rubber elasticity effect. The gel is consisted of elastomer units aligned in principal axes and the interstitial solvent. The elastomer units are assumed to maintain constant volume, and deformation effects in three axes are coupled by Poisson effect at the intersecting joints. Uniaxial tension in x-axis only is consider, and the net effect of the rubber elasticity is to change the osmotic pressure of solvent within the control volume.
stresses and strains of the elastomer units in x, y and z directions due to swelling and uniaxial tension in x-axis are then
![]() ,
, ![]() ,
, ![]()
![]() ,
, ![]() ,
, ![]()
where P is solvent pressure inside the gel, Po is ambient bath pressure, and Fx is tensile force in x-axis. Substituting above results to the general elasticity equations, we have
 .
.
Treating the effect of rubber elasticity as purely mechanical, the change in chemical potential of solvent due to the rubber elasticity is then ![]() . In addition,
. In addition, ![]() where vso is molar volume of pure solvent. Combining above results, we have
where vso is molar volume of pure solvent. Combining above results, we have
 .
.
It should be noted that n here is not same as the Poisson's ratio in conventional sense. It represents the overall mechanical coupling effect due to the coupling only at the intersecting joint region (not of solid elastomer for which n = 0.5), and we will refer to it as the "Poisson-like" ratio. In addition, one should note the limitations of this simple mechanical model, namely the lack of thermo-mechanical coupling --- the entropy spring effect. With real elastomer, there is thermal-mechanical energy conversion, as Flory's model describes in terms of entropy change due to deformation. This energy coupling behavior is expected to be unimportant in our isothermal, isobaric system. However, the importance of this coupling effect needs to be investigated for other systems.
3.2.4 Overall process: mixing/diffusion and deformation
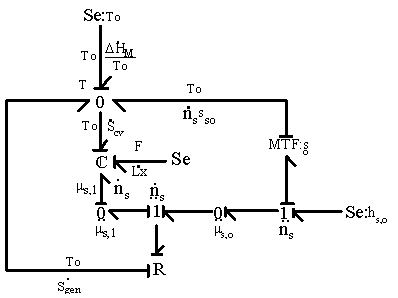
Combining the results on mixing/diffusion process and elastic deformation process, i.e., Dms=(Dms,M+Dms,el), the bond graph representation of overall process is shown in Figure 3.6. Note that for the surrounding solvent, hso = mso + Tsso.
3.2.5 Polymer gel swelling kinetics
Just as the fluid flow rate through a restricted pores as shown in Figure 3.7 can be characterized in terms of the net pressure difference between the inlet and the outlet, the solvent flow rate into and out of the gel during swelling and deswelling processes was
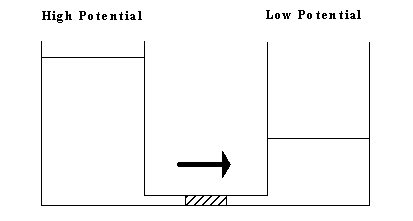
Figure 3.7: The gel's solvent's flow kinetic driven by chemical potential difference is analogous to the fluid flow through restrictive pores driven by hydrostatic pressure difference.
phenomenologically described in terms of solvent chemical potential difference across the system boundary;
![]()
where Pm represents the permeability of the solvent in polymer gel network. Recognizing that it may also be expressed in terms of the osmotic pressure difference as ![]() , dependencies of Pm on critical parameters such as gel thickness, cross-sectional area, and swelling degree can be explicitly defined by comparing with Darcyís law for flow through porous media,
, dependencies of Pm on critical parameters such as gel thickness, cross-sectional area, and swelling degree can be explicitly defined by comparing with Darcyís law for flow through porous media,
![]()
where U is the macro-scale "superficial velocity", defined as the flow rate Q divided by the total (solid plus fluid) cross-sectional area,
P is the macro-scale pressure,
Km is the permeability
mvis is the solventís fluid dynamic viscosity.
For simplified case where the pressure is a function of z-axis only, Darcyís law may also be expressed in terms of solventís molar flow rate as
![]()
where Dz is the gelís characteristic thickness solvent travels during swelling, and subsequently, we arrived at
![]()
Furthermore, the gel can be treated as a collection of essentially cylindrical polymer fibers aligned either parallel or perpendicular to the zero Reynolds number solvent flow as shown on Figure 3.8. It is assumed the fiber matrix consists of one-third parallel fibers and two-third perpendicular fibers, and an approximate analytic expression was obtained for the permeability of a periodic porous matrix (Happel and Brenner, Low Reynolds Number Hydrodynamics),


where a is the radius of the fiber and b is the fluid envelope radius (which is half the distance between fibers). The net effect on Km is then
![]()
Since

the dependence of permeability coefficient Km on swelling degree can be easily defined. Note that the only adjustable parameter is the cylindrical fiber radius, a, and according to sedimentation experiments (Ogston et. al.; 1973), the fiber radius of linear polymer is expected to lie between 0.3 nm and 0.8 nm.
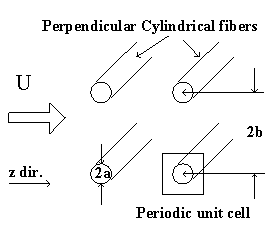
Figure 3.8: Happel and Brenner model of flow through porous media. The gel can be treated as a matrix of essentially cylindrical polymer fibers aligned either perpendicular or parallel to the zero Reynolds number solvent flow (parallel cylinders not shown in above diagram), and Happel and Brenner's model can be used to predict the permeability of interstitial solvent.
3.3 Dynamic Model of Electrolyte Gel
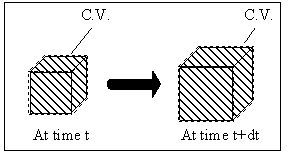
Figure 3.9: Control volume for electrolyte gel model. As with the non-electrolyte gel case, the gel's control volume changes with the material volume where the gel is consisted of polymer network, interstitial solvent fluid and mobile ions.
In addition to the modeling assumptions for the non-electrolyte gel model, let us also assume: (1) the characteristic length of gel element is much greater than the Debye length, (2) ionic concentrations inside the gel are uniform at any instant of time, and (3) ions behave as in ideal dilute solution; ![]() where mi,e is the electrochemical potential, xi,g is the mole fraction, zi is the valence and fi,g is the electrical potential of the ion i inside the gel.
where mi,e is the electrochemical potential, xi,g is the mole fraction, zi is the valence and fi,g is the electrical potential of the ion i inside the gel.
3.3.1 Equilibrium conditions
The Donnan membrane equilibrium phenomena is due to the balance between the diffusion tendencies toward uniform concentrations of each individual chemical species and the electrical attraction/repulsion among ions/fixed charge groups. Since the equilibrium condition requires the ions in both inside and outside the gel/membrane to have equal potential while satisfying the electroneutrality condition, electric potential develops across the gel/membrane interface. For example, diffusion tendency of the positively charged ion in Figure 3.10 tries to maintain equal concentration of the positive ion between the bath and the gel. Meanwhile the fixed negatively charged side groups of the polymer network attracts the positive ions from the bath, causing the positive ion's concentration to increase in the gel. As the result of this tug-of-war between the two forces, an electric potential is developed across the interface. It should be noted that the macroscopic electroneutrality is valid for dimensions much greater than the Debye length (Grodzinsky; lecture note).
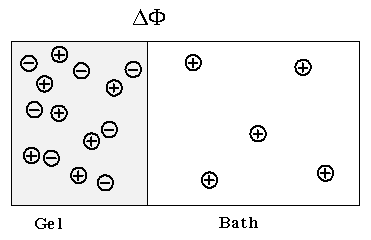
Consider the ionic gel immersed in ionic solvent bath. Safely assuming the concentration of the mobile ions in both the gel and the solvent bath to be much smaller than the concentration of polymer or solvent, the mobile ion concentration can be treated as in dilute solution, and the electrochemical potential of the ions can be described by
![]()
where ![]() is the electrochemical potential of the ion specie i [J/mol],
is the electrochemical potential of the ion specie i [J/mol],
![]() is the chemical potential of the pure ion specie i,
is the chemical potential of the pure ion specie i,
R is the universal gas constant, 8.314 J/(K*mol),
T is the temperature [K],
ai is the activity coefficient of the ion,
zi is the ionic valence,
F is the Faraday constant, 9.648 x 10⁴ coul/mol,
![]() is the electrical potential of the ion [volt].
is the electrical potential of the ion [volt].
When the electrolyte in both the gel and the bath is in true equilibrium, the electrochemical potential of the ion in the bath will be equal to the electrochemical potential of the ion inside the gel,
![]()
where ![]() is the electrochemical potential of the ion inside the gel, and
is the electrochemical potential of the ion inside the gel, and
Since ![]() is same for both the gel and the bath phases, we have
is same for both the gel and the bath phases, we have
![]()
or
![]()
where ![]() is
is ![]() , the electrical potential difference across the gel-bath interface. Since this electrical potential difference is imposed to all ions, the activity coefficient ratio across the interface of different ions, say i and j, are related by
, the electrical potential difference across the gel-bath interface. Since this electrical potential difference is imposed to all ions, the activity coefficient ratio across the interface of different ions, say i and j, are related by

For the 1:1 electrolyte where zi = 1 and zj = -1, the above expression reduces to
![]()
For the case where the activity coefficients in the gel and bath phases are equal or for the ideal dilute solution case, we can also write in terms of the mole fractions or the concentrations
![]()
or
![]()
where xig, xib , cig, cib are the mole fractions and concentrations [mol/m3] of the ion i in the gel and the bath, and xjg, xjb , cjg, cjb are the mole fractions and concentrations [mol/m3] of the ion j in the gel and the bath, respectively. In addition, the bulk electroneutrality for the bath and the gel are
![]() for external bath
for external bath
![]() for inside the gel/membrane
for inside the gel/membrane
where ![]() is the fixed charge group density [coul/m3], and
is the fixed charge group density [coul/m3], and ![]() is the ion concentration inside the gel/membrane.
is the ion concentration inside the gel/membrane.
The Donnan equilibrium and electroneutrality conditions, along with charge conservation relations, can be used to compute individual ion concentrations. Strictly speaking, the above result applies only to true equilibrium case. However, in general, it can also be applied to non-equilibrium case as long as the net transport is much slower than the diffusion or the drift components of the transport process (Grodzinsky). In the following section, lumped parametrized dynamic elements representing the chemical and electric potential capacitances are developed.
3.3.2 Chemical capacitance model
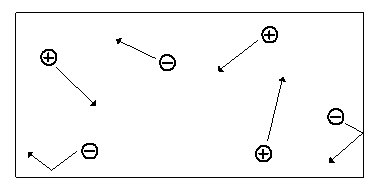
Figure 3.11: Ideal dilute solution. Since the concentrations of ions in the gel are much less than the effective concentrations of either the solvent or the polymer network, the ions are modeled to be in ideal dilute solution.
With the assumption of dilute solution, the chemical potential of ion in the gel may be described by
![]() .
.
Treating the polymer molecule as solvent/ion size molecule with equivalent scaling factor, s, the effective mole fraction of ion, xi is then
![]()
and

Then, the rate of change of ionís chemical potential with respect to time may be approximated by


Since the chemical potential of ion can be changed by either the ion transport or the solvent flow into the control volume, the ion's chemical potential needs to be modeled as a coupled two port capacitance as shown in Figure 3.11 where Cc,i represents the chemical potential capacitance of ion specie i.
3.3.3 Electric potential capacitance model
Bulk electroneutrality
The ions with greater diffusivity will tend to move across the medium at faster rate than the ions with lower diffusivity. However, such tendency for charge separation induces local electric field among ions, and it in turn acts to retard the faster ions and to accelerate the slower ions. For instance, if the faster ions are positively charged whereas the slower ions are negatively charged, then positive local electric potential gradient will build up to retard the positive ions and to accelerate the negative ions. Such a "local" electric field, which acts at scale of a few Debye length, is quite large and thus it is rather difficult to induce charge separation in macroscopic scale. Therefore, at macroscopic scale, the electroneutrality prevails.
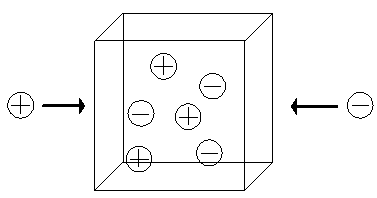
The electrical potential coupling among ions due to such bulk electroneutrality effect can be modeled as a simple ideal parallel plate capacitor (Oster)
![]() ,
, ![]()
![]()
where ![]() is the induced electric potential,
is the induced electric potential,
CE,i is the electric potential coupling capacitance,
![]() is the dielectric constant of the electrolyte,
is the dielectric constant of the electrolyte,
A is the cross-sectional area of the ion transport [m2],
d is the typical maximum separation of charges in a volume element, ~ 10-10 m,
qi is the charge of the ion [coul].
The bond graph representation is shown in Figure 3.13 where CE,i represents the bulk electroneutrality potential capacitance of ion species i. Note that the "local" electric potential acts in the scale of a few Debye length in strict sense, and for mediums with much greater scale, ![]() here only models its approximate net effect on the bulkís electric potential. Furthermore,
here only models its approximate net effect on the bulkís electric potential. Furthermore, ![]() is modeled as a transient effect which diminishes at an equilibrium even though the local electric field among ions would continue to exist in microscopic scale.
is modeled as a transient effect which diminishes at an equilibrium even though the local electric field among ions would continue to exist in microscopic scale.
Macroscopic electric potential gradient
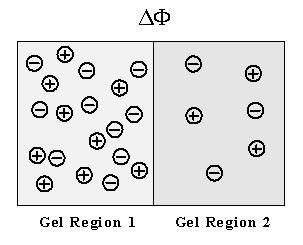
Figure 3.14: Macroscopic electric potential gradient due to difference in fixed charge concentrations. As with the Donnan potential across gel/membrane interface, an electric potential gradient can build up even between two regions of gel if their fixed charge concentrations differ from each other.
Although the bulk electroneutrality requires zero net background charge density in each region of electrolytic medium, this does not require total net charge, ru, in a region to be nonexistent as well. As an illustration, consider a monoprotic binary ion case as explained by Grodzinsky. Defining the total concentrations of charges c+ and c- as sums of background and perturbation components,
![]()
the total net charge, ru, in a region can be written as
![]() .
.
The bulk electroneutrality requires zero net background charge density
![]()
and therefore, the net charge, ru, is
![]()
which is much less in magnitude than that of background densities of either species. According to Gaussí law which relates the electric field gradient to the net charge at a point,
![]()
existence of such net charge thus induces electric potential gradient at a point while maintaining bulk electroneutrality in the region. (Although one needs to solve the Gaussí law in order to describe the electric potential profile exactly, it will not be analyzed in detail here due to complexity as well as lack of necessity for the exact electric potential profile inside the gel for our purpose.) For example, the Donnan equilibrium membrane potential is the electric potential gradient that arises across the membrane interface due to net charges induced by the balance between the individual ion diffusion tendencies and the bulk electroneutrality in each region.
In the case of true equilibrium, the electrochemical potentials of the ions are equal across the two regions, and as discussed previously, the resulting electric potential difference between the regions is described by
![]()
for any ion species, i or j. Although the system of our interest is not at true equilibrium during the process, we will assume that the condition is near equilibrium, and we will model the electric potential difference between two uniform media regions (Figure 3.14) as the average of the individual ion specieís near equilibrium contribution to the electric potential buildup. Defining the reference electrical potential to be at the electrically neutral surrounding bath, the individual ion contribution to the electric potential, ![]() and the average electric potential
and the average electric potential ![]() at a region are modeled as
at a region are modeled as
![]()

Overall effect
Combining above results, the total electric potential at a region may be expressed as

or

The rate of change of electric potential is then

Note that applying above result to the surrounding bath, we get

which becomes zero, i.e. reference potential, since it is defined to be electrically neutral.
3.3.4 Kinetic model
The transport of ions due to diffusion and migration in the electrolytic medium is described by the following relation (neglecting the convective contribution)
![]()
where ![]() is the molar flux of the ith species ion [mol/m2*sec],
is the molar flux of the ith species ion [mol/m2*sec],
Di is the diffusion coefficient [m2/sec],
ci is the concentration [mol/m3],
ui is the mobility [m2/volt*sec],
zi is the valence of the ith species,
![]() is the electrical potential [volt].
is the electrical potential [volt].
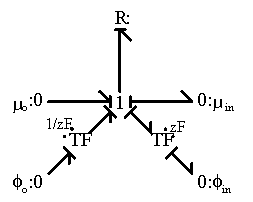
Figure 3.15: Bond graph representation of ion transport. The ion transport is driven by the combination of chemical and potential gradients. The entropy generation is neglected here.
Modeling both the concentration and electrical potential gradient inside the gel medium as linear and considering only one dimensional case for simplification, the average ion transport relation of ions into the gel can be expressed as
![]()
where ![]() ,
,![]() are the ion concentration and electrical potential net differences between inside the gel and outside bath, i.e.
are the ion concentration and electrical potential net differences between inside the gel and outside bath, i.e. ![]() , and
, and ![]() is the separating distance. The first term describes the diffusion component due to the concentration gradient, and the second term describes the migration component due to the electric potential gradient. Since the electric potential gradient is commonly experienced by all ions, it is the source of coupling effect among ions. Studying the expression for the ion transport above, one can easily represent this using a bond graph resistive structure as shown in Figure 3.15 where the ion transport is a function of the net electrochemical potential difference, i.e.:
is the separating distance. The first term describes the diffusion component due to the concentration gradient, and the second term describes the migration component due to the electric potential gradient. Since the electric potential gradient is commonly experienced by all ions, it is the source of coupling effect among ions. Studying the expression for the ion transport above, one can easily represent this using a bond graph resistive structure as shown in Figure 3.15 where the ion transport is a function of the net electrochemical potential difference, i.e.: ![]() . Note that the above bond graph structure suggests a entropy generation port at the resistance field. However, we assumed it is negligible for simplicity since its effect on the gel's swelling would be minimal.
. Note that the above bond graph structure suggests a entropy generation port at the resistance field. However, we assumed it is negligible for simplicity since its effect on the gel's swelling would be minimal.
The ion transport kinetics of the resistive element suggested by the bond graph structure is simply
![]()
Comparing this expression to the generally used ion transport equation

we get the expression for the ion's transport coefficient Ki
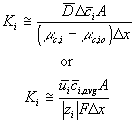
For our model, we used the average value of the above Ki's.

Combining above results, the ion transport process between two regions is represented in bond graph formalism in Figure 3.16(a) where CDi, CEi, CDi represent the Donnan membrane, bulk electroneutrality and chemical potential capacitances of ion at a region i. Lumping the individual capacitance components CDi and Cei together into single
capacitance field produces less cluttered views in Figure 3.16 (b) and (c). Note the solvent port at the chemical capacitances were not shown in the figure to reduce clutter.
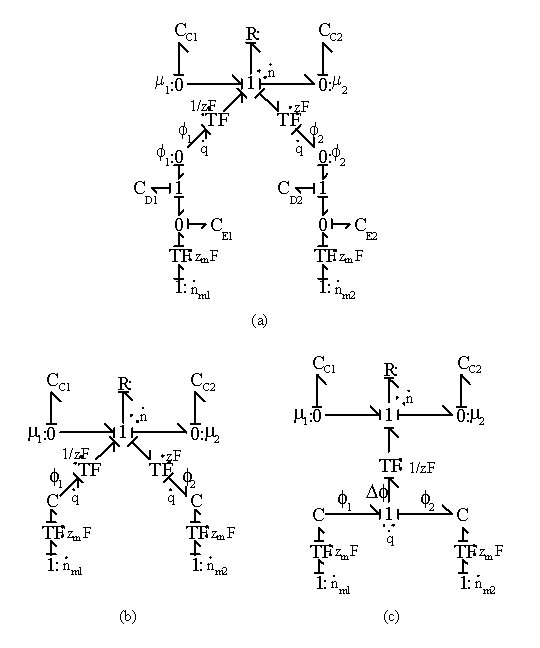
Figure 3.16: Bond graph representations of ion transport process between two regions. CDi, CEi, CDi represent the Donnan membrane, bulk electroneutrality and chemical potential capacitances of ion at a region i. Lumping the individual capacitance components CDi and Cei in (a) together into single capacitance field produces less cluttered views in (b) and (c).
3.3.5 Ion diffusion limited reaction
As the ion moves into the gel/membrane network, it may also react with the fixed charged side groups as illustrated in Figure 3.17. Namely diffusing H+ or OH- in solvent can react with corresponding conjugate basic or acidic structures on the network, and it was shown that such diffusion-reaction can significantly slow down the overall ion transport process (Grodzinsky). As the ions are moving into the gel network while reacting with the fixed charges of network simultaneously, not only is the overall kinetic of the ionís transport affected, also the concentrations of both the mobile ions and the fixed charge groups are changed as well, subsequently changing the overall equilibrium behavior. Therefore, proper integration of the dynamic model of ion diffusion limited reaction process is necessary.
Chemical reaction
Assuming the predominant chemical reaction is the acid/base reaction between the H+/OH- and the fixed charge groups, we will limit the discussion to acid/base reaction only. However, the results can be translated to other types of reactions as well.
Consider the case of gel/membrane with negatively charged fixed side groups with pKa below 7. The side group is negatively charged when the internal pH is above its pKa, whereas it is neutral when the internal pH is below its pKa. When the internal pH is equal to the pKa, this implies exactly half of the total side group is dissociated. In acidic environment, there are two reactions occurring simultaneously. First, the neutral side group of gel/membrane network can dissociate into anion and hydronium ion
![]()
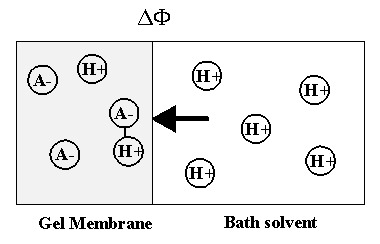
Figure 3.17: Diffusion limited reaction of H+ ion. As the H+ ion moves into the gel network, it may react with corresponding conjugate basic structures on the network, and such diffusion-limited reaction can significantly slow down the overall ion transport process.
where AHb is the neutral side group of gel network,
A- is the network-bound anion,
H3O+b is the hydronium ion originally bound to AHb.
The bond graph representation shown below.
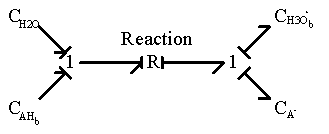
The chemical reaction is represented by a two-port resistance field where the thermal (entropy generation) port is not included. In the case where the thermal port is of importance, it can be modified as
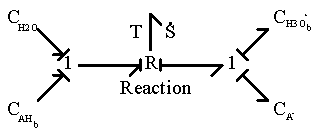
Second, the hydrogen ion diffusing in from outside can associate with the network-bound anion, A- to form the neutral side group.
![]()
where H3O+d is the hydronium ion diffusing into the gel network,
AH d is the neutral side group formed.
The corresponding bond graph representation (neglecting the entropy generation) is
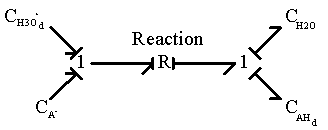
and since H3O+d is identical to H3O+b, the above two reactions are identical.
It should be noted that the reaction model by itself assumes that there is no additional creation or depletion of the chemical species. In other words, the specified reactions are the only processes through which the concentration of chemical species can change, and thus the total molar quantity of all species must stay constant. Otherwise, the individual speciesí chemical capacitances cannot be specified by the reaction coordinate alone, and they must be modeled as more complicated coupled multiport capacitance fields. Unfortunately, such chemical reactions are rather common, and our case is not an exception; the amounts of H2O and H3O+ within the control volume can vary independently of the acid/base reaction through swelling and H3O+ ion transport, and the bond graph representation of gel system with multiport capacitance fields then would be

In this representation, the additional ports at the capacitance fields are not drawn explicitly due to complexity, but they are denoted as flow variables in parenthesis.
However, we can simplify above model since the molar quantity of H2O is orders of magnitude greater than any other chemical species, including that of H3O+, and thus the effects of other species on the chemical potential are negligible. In this case, the additional ports for H2O flow would be significant at the capacitance fields. In addition, note that since the net charge produced by the chemical reaction is always zero for this particular case, it has no effect on macroscopic electroneutrality. However, it changes H3O+ concentration, and thus the Donnan potential would be affected.
Chemical reaction kinetics
According to the simple mass-action law for elementary chemical reaction expressed as
![]()
where kf is the forward reaction constant, and
kr is the reverse reaction constant,
the reaction kinetic is commonly expressed as
![]()
where the equilibrium constant Keq in this case would then be
![]()
We assumed that the electric potential has negligible effect on the chemical reaction, and for simplicity, modeled both the fixed side groups and the hydrogen ions as dilute solutions, i.e.,

where xAH, xA- and xH+ are mole fractions of AH, A- and H+ respectively. Since concentrations of AH, A- and H+ are much smaller than the concentration of solvent, the mole fractions can be related to corresponding concentrations as
![]()
where vs is the molar volume of the solvent. In addition, the rate of concentration changes of AH is related to the rate of mole of AH change by
![]()
The reaction kinetic expression can then be expressed as
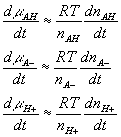
where


![]()
![]()
Quasi-equilibrium chemical reaction
In many cases, simplifications can be made with assumption that the reaction occurs at much faster rate than the diffusion, and thus can be considered as "instantaneous" and "always" at equilibrium (quasi-equilibrium). This does not imply that the concentrations of A-, H+ or AH do not vary with time, but they change at a rate much slower than the reaction rate, limited by the diffusion of the hydrogen ion into the gel/membrane unit. The quasi-equilibrium reaction model says at every instant of time
![]()
or

Since the total possible number of the binding site -A is fixed
![]()
the equilibrium constant Keq can also be written as
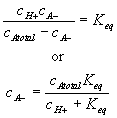
Differentiating this with respect to time, we get
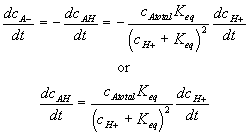
For such quasi-equilibrium reaction, the bond graph representation of the diffusion-reaction (electric potential port not shown) are shown in Figure 3.18. Note the bond graph model shows that only three out of total four capacitances have integral causality implying only three capacitances are independent energy storage elements whereas the other one is dependent. This result is in agreement with the above analysis since the AH and A- concentrations are dependent of each other. As before, the entropy generation is assumed to be unimportant in the overall dynamics of the ionís transport for the quasi-equilibrium chemical reaction model.
3.3.5 Overall ion transport process: binary solution case
When an ionic gel with thickness that is much greater than the Debye length is immersed in an electrolytic solution, the gelís surface interface region, which is only a few Debye length thick, reaches the equilibrium state almost instantaneously while the inner bulk regions equilibrate at a much slower rate. Therefore, the interface region needs to be treated separately from the bulk units, and modeling of gelís ion transport process thus involves at least 3 phases: bath, gel interface and gelís bulk unit. (For simplification, the external solvent bath may be modeled as a ideal ions/solvent source as well as an electric potential reference ground.)
As an illustration of how the model elements developed so far can be integrated together, the simplest case where a hypothetical negatively charged gel is immersed in the 1:1 binary electrolyte solution (H+, Cl-) is considered, and the bond graph representation of the resulting model is shown in Figure 3.19. The model consists of the gelís interface and the bulk unit connected in series to the solvent bath. The chloride ion is a completely dissociated ion of the strong acid, HCl, and is assumed not to react or bind with other ions or fixed charges. The dissociation of gel bound groups AH produces fixed charges A- and hydronium ion H3O+ which in turn influence the ion transport in the gel through changing both the H+ concentration and the Donnan electric potential. As mentioned previously, the electroneutrality is not affected by the dissociation chemistry of AH since the valences of produced charges are exactly opposites, but the Donnan potential is affected.
As before, the solvent and ions' chemical capacitances should be modeled as coupled multiport capacitance field in strict sense. However, since the amounts of ions are much
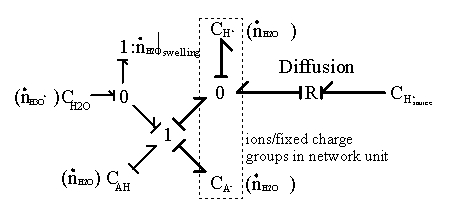
Figure 3.18: Bond graph representation of quasi-equilibrium diffusion-limited reaction of H+ ion. Assuming the reaction to occur at much faster rate than the diffusion, the reaction is considered to be "instantaneous" and "always" at equilibrium. Note only three out of total four capacitances have integral causality implying only three capacitances are independent energy storage elements. This is in agreement with the quasi-equilibrium assumption that the AH and A- concentrations are dependent of each other.
smaller than that of solvent and polymer, we can safely assume that inclusion of only the solvent flow port should suffice in this case as well.
According to the bond graph model, it is interesting to note that the electric potential differences can exist even between the interface region and the bulk unit (or even between bulk units if there are more than one) during the transport process since the internal pH and subsequently the fixed charge density of each region may well differ from each other. Unlike the Donnan potential difference between the bath and the gelís interface, this electric potential differences would vanish at equilibrium when the uniform fixed charge density is achieved between interface and bulk unit. Note that the governing dynamics of interface unit and the bulk unit are identical.
Furthermore, the region situated just inside of the gelís surface by a few Debye lengths reaches the equilibrium states almost instantaneously when compared to the rest bulk of the gel, and its equilibrium states may be treated as the boundary conditions for the bulk
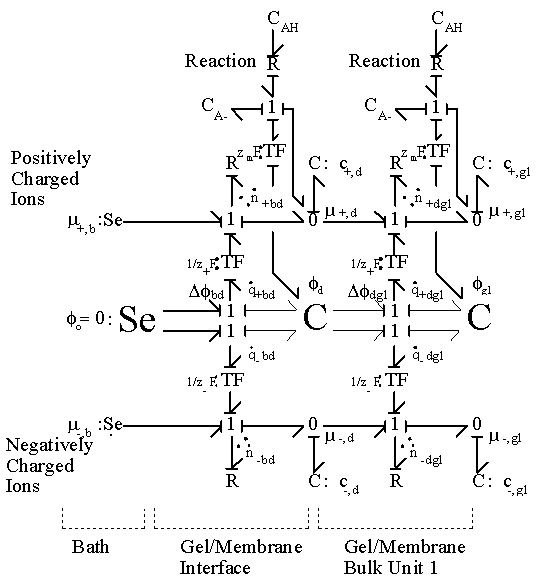
Figure 3.19: Bond graph representation of ionic gel immersed in aqueous bath with H+ and Cl- ions. The gel is consisted of the surface interface region which equilibrates almost instantaneously and the much slower bulk unit connected in series. The H+ ion also undergoes chemical reaction with the fixed charge groups of network.
unit. In such case, the above representation further simplifies to representation in Figure 3.20.
Governing equations
Corresponding governing dynamic equations are
![]()

where

![]()
![]()
![]()


According to above dynamic equations, the time constants of hydronium and chloride ionsí transport processes are
 .
.
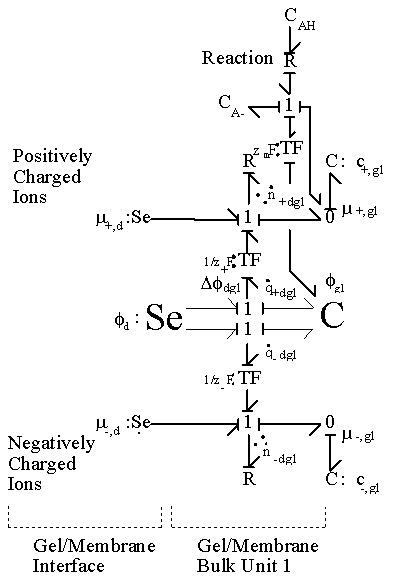
Figure 3.20: Bond graph representation of ionic gel immersed in aqueous bath with H+ and Cl- ions. Since the interface region equilibrates at several orders of magnitude faster than the bulk unit, the equilibrium states of the interface unit can be treated as the boundary conditions for the bulk unit.
When the diffusing hydronium ion is reacting with the fixed charges of the gel whose pKa is within the gel's active pH ranges, the transport of hydronium ion will be the limiting process of overall ion transport kinetics since the term in the bracket of hydronium ionís time constant would be much greater than unity. For the complete model of polyelectrolyte gel, above model needs to be incorporated into the model representing the swelling behavior of the gel as described in the following section.
3.3.6 Ionic contribution and electrolyte gel swelling
Mixing/diffusion process
Similarly to the non-electrolyte gel model, the quasistatic differential energy change of the control volume due to the mixing/diffusion within the gel itself can be expressed as
![]()
Since the ion concentration inside the gel is much less than the concentrations of either the polymer or the solvent, the contribution of ions to the change in free energy is assumed to be additive (Flory), i.e.,
![]()
![]()
![]()
Note the first term in the bracket of right hand side is the ![]() for the non-electrolyte gel, and since
for the non-electrolyte gel, and since ![]() , above expression reduces to
, above expression reduces to
![]()
Similarly, the entropy change due to mixing is
![]()
or
![]()
where the ionic contribution to enthalpy change is assumed to be zero and the second term on right hand side represents the entropy generated due to mixing of ion within the gel. In addition, the ionic contribution to the chemical potential change of the solvent is also assumed to be additive (due to sufficient dilution of ions)
![]()
where
![]() (vanít Hoff equation)
(vanít Hoff equation)
The solvent flow kinetic will be identical to the non-electrolyte gel case.
Bond graph representation
The bond graph representation of polyelectrolyte gelís mixing process derived above can be expressed as in Figure 3.21, and incorporating with the ion transport model and applying for the case of binary electrolyte solution, we arrive at the bond graph as shown in Figure 3.22.
Limiting process
Even with the simple binary ion case and a single bulk unit, we have four coupled independent dynamic equations describing the overall dynamic process: two for each ion specieís chemical capacitances, one for the electric potential capacitance and one for the solventís chemical capacitance. In order to be useful for real-time control, it is evident the model needs to be simplified further, and fortunately, further simplification can be made. Grimshaw et. al. has shown that for some gels, the swelling rate is limited by the diffusion-limited reaction of H+ ions with the gelís charge, and according to De Rossi, such is the case for the gel of our interest, poly(vinyl Alcohol)-poly(acrylic acid) (PVA-PAA), when the pH of the solution (modulated by HCl in H2O) in equilibrium with the gel is higher than 2.9. As expected, De Rossi showed the overall dynamics of the gel is of first order with time constant,
 .
.
Therefore, our strategy is to first identify the limiting process for the gel and solution of our interest, and reduce the overall dynamics to the first order coupled dynamic equation.
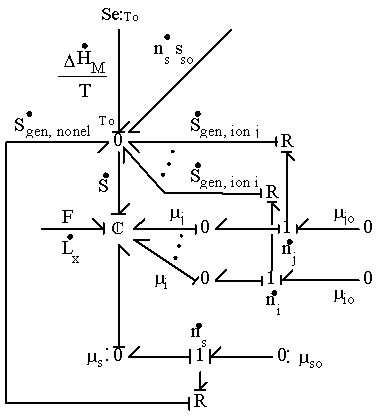
Figure 3.21: Bond graph representation of polyelectrolyte gel's mixing process. Since the ion concentration inside gel is small, the contribution of ions to the change in free energy of gel is assumed to be additive to the solvent mixing/diffusion and the rubber elasticity effects.
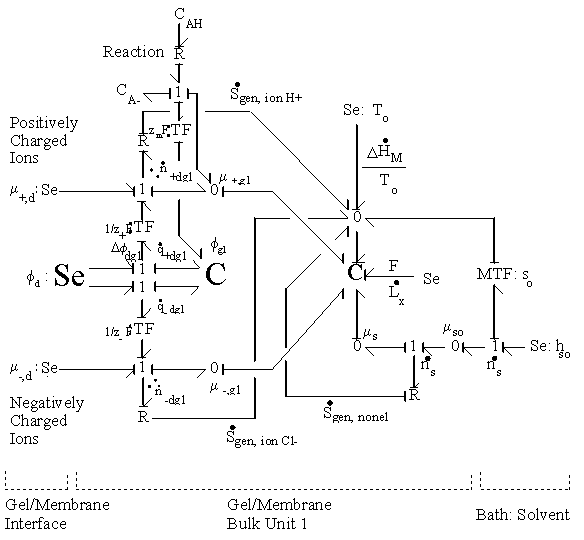
Figure 3.22: Bond graph representation of negatively charged electrolyte gel in binary electrolyte solution. The interface unit's equilibrium conditions are treated as the boundary conditions for the bulk unit.
Chapter 4
Model Verification
4.1 PVA-PAA in Acetate Buffer Solution
In order to verify the lumped parameter model of the polymer gel, a poly(vinyl Alcohol)-poly(acrylic acid) (PVA-PAA) gel in acetate buffer bath solution was used. PVA-PAA gel was selected for several reasons. First, the PVA gelís polymeric characteristics (from which the PVA-PAA gel's characteristics were estimated for our purpose) have been investigated extensively, and the parameters such as the polymer-solvent interaction parameter has been well characterized. Second, the PVA-PAA gel is a univalent gel with carboxylic charge groups, and it exhibits continuous swelling with respect to pH within the active range. On the other hand, gels such as the poly(acrylonitrile) (PAN) gel fibers possess excellent mechanical properties, but exhibit severe hysteresis on swelling behavior. Such hysteresis is believed to be due to the gelís amphoteric nature. Third, the PVA-PAA gel is relatively easy to prepare and cast into desired shape. The gel preparation procedure will be described in detail later. Lastly, researchers such as De Rossi have already studied the PVA-PAA gel, and parameters such as the gelís pKa have already been found (Chiarelli and De Rossi, 1988).
Although most of the studies on the PVA-PAA gel have been conducted in aqueous solution, where pH was modulated by addition of hydrochloric acid (HCl), such solution environment is not appropriate for controlling the swelling degree of the gel. Because the HCl is a strong acid, it completely dissociates instantaneously, and the pH level of the solution will be extremely sensitive to the amount of HCl added to the water, especially at near the neutral range. Modulation of the solution's pH to the desired level precisely will be difficult, and subsequently, controlling the swelling degree of the gel would be difficult as a result. Therefore, we have opted to use the acetate buffer solution with its pH adjusted to neutrality (pH 7) with sodium acetate, and during the experiment, the solution's pH is subsequently modulated to desired value with HCl. The acetate buffer solution resists changes in pH by the ability to combine with H+ ions, and the desired pH level can be therefore accurately achieved. In this case, note that four monovalent ions (rather than two of HCl aqueous solution) are involved in gel swelling process, and they are hydronium ion (H+), sodium ion (Na+), chloride ion (Cl-), and acetate ion (C2H3O2-).
4.1.1 Acetate buffer chemistry
A buffer is a solution characterized by the ability to withstand changes in pH when limited amounts of acid or base are added to it, and in this section, the acid/base chemistry of the acetate buffer solution is reviewed with understanding that the knowledge of the ion concentrations in the bath solution is critical in predicting the swelling of the ionic PVA-PAA gel.
Acetate buffer solution preparation
Given pure acetic acid and sodium acetate, we first need to figure out what concentrations of each chemical should be mixed together to produce the acetate buffer solution with desired pH of 7. Consider the acid ionization of the acetic acid, HC2H3O2
![]()
where the acetic acid and the sodium acetate with initial concentrations A and C are mixed in water;
![]()
Upon mixing, suppose x mole of the acetic acid is dissociated. As a result, the concentration of the acetic acid would decrease by x mole, and the concentrations of the hydronium and acetate ions would increase by x mole respectively.
![]()
Substituting the final concentrations into the equilibrium equation

we get
![]()
Assuming x << A, C for simplicity (which should be checked), above expression further reduces to
![]()
Acid ionization constant, Ka, of acetic acid is 1.7x10⁻⁵. Therefore, in order to produce the acetate buffer solution with pH = 7 ([H3O+] = 1x10⁻⁷), the initial concentration ratio of sodium acetate to acetic acid should be 170. In our case, we have chosen the initial concentrations of acetic acid and sodium acetate to be 0.001 M and 0.17 M respectively. (Note that both A and C are much greater than x, thus satisfying the assumption.) At equilibrium, the resulting ion concentrations were
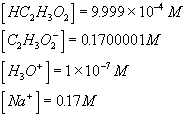
pH modulation: lowering pH
As HCl is added to the acetate buffer solution to modulate the bath pH, the equilibrium ion concentrations and pH can be calculated given the added amount of HCl following an analysis similar to the one illustrated above.
Suppose VH in volume of Ho molar HCl is added to the pH 7 buffer solution of volume Vo with equilibrium ion concentrations of A and C for acetic acid and acetate ion, respectively
![]()
For the purpose of analysis, the overall chemical reaction can be broken into two separate steps: complete reaction between strong acid and buffer ion, and acid ionization equilibrium. The added HCl is a strong acid, and it will completely dissociate instantaneously. Therefore, the newly formed hydronium ions will then completely react with the acetate ions to form acetic acid, and this initial reaction between H+ and C2H3O2- is
![]() .
.
The new total volume of the solution is Vo+VH, and consequently, the concentration of the H+, C2H3O2- and HC2H3O2 are changed to
![]()
Following the complete reaction between H+ and C2H3O2-, the acid ionization process occurs. As before, suppose x mole of the acetic acid is dissociated due to ionization. As a result, the concentration of the acetic acid would decrease by x mole, and the concentrations of the hydronium and acetate ions would increase by x mole respectively.
![]()
Substituting the final concentrations into the equilibrium equation

we get
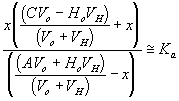
Assuming
![]()
for simplicity, above expression then reduces to
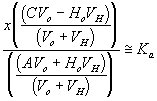
Therefore, in order to achieve the desired hydronium concentration of x, the amount of HCl necessary is
![]()
pH modulation: raising pH
Driving the polymer gel based actuator to contract and expand requires changing the pH level of bath solution, and so far we have only discussed adding HCl to the buffer solution which lowers the pH level. In order to raise the pH level to cause the gel to expand, we can replace a portion of the bath solution with the neutral buffer solution, thereby effectively lowering the H+ concentration (and thus raising pH). Such method, however, wastes excessive fluid, and definitely is not a viable option for a practical actuator. Instead, a more effective method would be to neutralize the acid with a strong base such as sodium hydroxide (NaOH). However, this option has its own disadvantage. In the process of neutralization, salt (NaCl) and water are produced,
![]()
and the ion concentrations in the bath solution are changed. Therefore, the effect of the acid-base neutralization process on the bath's ion concentrations need to be considered. Fortunately, its effect can be easily accounted for since the sodium hydroxide completely reacts with the acid, and overall effect is simply reduction of H+ and increase of H2O and Na+ by same number of mole of NaOH added. With an appropriate adjustment in initial reactant concentrations, analysis described in the previous section can be applied to compute the equilibrium ion concentrations.
4.1.2 PVA-PAA gel preparation
The PVA-PAA gel strips were prepared by drying the PVA-PAA solution on a Lexan plate into a thin film and baking in an oven at 120 C for 30 minutes. Molecular weights of the PVA and PAA used were 31,000-50,000 and 90,000, respectively, and the PVA-PAA solution was prepared by mixing 60% and 40 % by weight of PVA and PAA in distilled water. Lexan has been chosen as the drying plate because dried PVA-PAA film was found to peel off easily. On the other hand, PVA-PAA film tends to stick to glass and Plexiglass. The dried film was cut into desired shapes and sizes before they were baked, since baking causes the film to become brittle. The baked PVA-PAA strips were soaked in distilled water for 48 hours, and subsequently soaked in the acetate buffer solution for 24 hours. It should be noted that the stiffness of the gel was extremely sensitive to the baking temperature and duration, and even the difference of 15 seconds in baking time yielded noticeable difference in the degree of swelling.
4.2 Equilibrium swelling model verification
4.2.1 Equilibrium swelling model
The equilibrium swelling of the polymer gel is such that the chemical potential of the solvent (which is water in this case) in the surrounding bath is identical to that of the solvent in the gel
![]()
while also maintaining the Donnan equilibrium and bulk electroneutrality conditions of the gel.
According to our previously developed model of the electrolyte polymer gel, the chemical potential of the solvent in the gel is
![]()
where

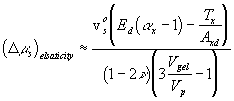
![]()
and the chemical potential of the bath's solvent may also be approximated by
![]()
The Donnan equilibrium condition and the bulk electroneutrality condition impose

![]()
and the diffusion reaction chemistry of the fixed charge also requires

The ion concentrations of bath solution are computed based on the analysis presented in the previous section, and since the concentrations of the mobile ions and the fixed charge inside the gel also depend on the swelling degree of the gel, the final equilibrium state of the gel is such that the above expressions are simultaneously satisfied.
4.2.2 Experimental procedure
Constant tension test
Baked thin PVA-PAA gel films of dry dimensions Lydo = 4.00 mm, Lzdo = 0.103 mm were first washed in distilled water for 48 hours, followed by immersion in the buffer solution of pH 7 for 24 hours to ensure that they have reached their equilibrium states. Once the equilibrium state had been reached, the terminations were mounted at each end of the gels as shown in the diagram below. The termination blocks were made of Lexan, and the PVA-PAA gel film ends were clamped into the slots of termination blocks.
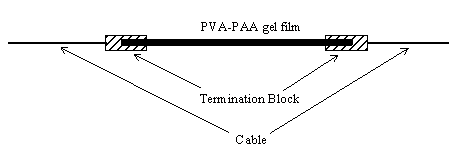
A constant tension of 6.098 x 10⁻² N was applied by hanging a weight of 6.207 gram. Bath solutions with various degrees of HCl concentrations were prepared, and the PVA-PAA gel film samples in constant tension were immersed in each bath solution for 24 hours, at which point the dimensions in x and y directions were measured with caliper. The bath temperature was periodically monitored to ensure that the isothermal assumption were met. The acetate buffer to one molar HCl volume ratios tested were 100:2, 100:4, 100:6, 100:8, 100:10, 100:13 and 100:16, respectively. The corresponding pH's of the bath were 5.62, 5.27, 5.03, 4.82, 4.61, 4.25 and 3.56, respectively.
Salt content test
To test the effectiveness of the electrolyte gel model in the presence of high salt content in the bath solution, NaCl has been added to bath solutions of pH units 5.27 and 4.82 such that the salt concentrations were 0.2 M and 0.5 M for each pH unit. The PVA-PAA gel film samples were immersed in each solution for 24 hours with no tension applied, and the dimensions were measured with caliper.
4.2.3 Experimental result
The averaged results from the constant tension test and the salt content test are tabulated below:
Buffer : HCl Ratio
|
100:2 |
100:4 |
100:6 |
100:8 |
100:10 |
100:13 |
100:16 |
|
|
a x |
2.05 |
2.00 |
1.97 |
1.94 |
1.88 |
1.77 |
1.66 |
|
a y |
1.95 |
1.88 |
1.83 |
1.79 |
1.72 |
1.62 |
1.53 |
Constant tension experiment (Tension = 6.098 x 10⁻² N)
Buffer : HCl Ratio
|
100:4 |
100:8 |
|
|
0.2 M NaCl |
1.87 |
1.78 |
|
0.5 M NaCl |
1.81 |
1.73 |
Length ratios at various salt and HCl content.
The length ratios in x and y directions from the constant tension experiment were plotted against the bath pH in Figure 4.1. The standard deviations of the experimental data ranged from 0.007 to 0.019 for x direction and from 0.012 to 0.035 for y direction, respectively, and the instrumentational measurement errors in length ratios for x and y directions were ![]() respectively. (Because the gel strip's width was much smaller than the length, the instrument's measurement error had much greater effect in length ratio error of y direction than of x direction.) The degree of swelling of the gel samples were extremely sensitive to the baking temperature and duration. Even slight variations in time the oven door was opened to put the sample in or the baking time, resulted in a noticeable difference in the amount of swelling. Although the baking time could be controlled accurately, the time in which the oven door was opened could not be repeated accurately. This resulted in inconsistent heat leakeage, and subsequent difficulty in repeating identical swelling in the gel samples. Furthermore, the gel's tendency to shrink when taken out of the solvent bath for measurement -- especially in contracted state -- in addition to its transparency, made measurements difficult. In the plots of Figure 4.1, the standard deviations for each pH units were denoted by the vertical interval bars around the mean experimental values, and the additional measurement error interval bars were plotted at above and below the respective standard deviation intervals.
respectively. (Because the gel strip's width was much smaller than the length, the instrument's measurement error had much greater effect in length ratio error of y direction than of x direction.) The degree of swelling of the gel samples were extremely sensitive to the baking temperature and duration. Even slight variations in time the oven door was opened to put the sample in or the baking time, resulted in a noticeable difference in the amount of swelling. Although the baking time could be controlled accurately, the time in which the oven door was opened could not be repeated accurately. This resulted in inconsistent heat leakeage, and subsequent difficulty in repeating identical swelling in the gel samples. Furthermore, the gel's tendency to shrink when taken out of the solvent bath for measurement -- especially in contracted state -- in addition to its transparency, made measurements difficult. In the plots of Figure 4.1, the standard deviations for each pH units were denoted by the vertical interval bars around the mean experimental values, and the additional measurement error interval bars were plotted at above and below the respective standard deviation intervals.
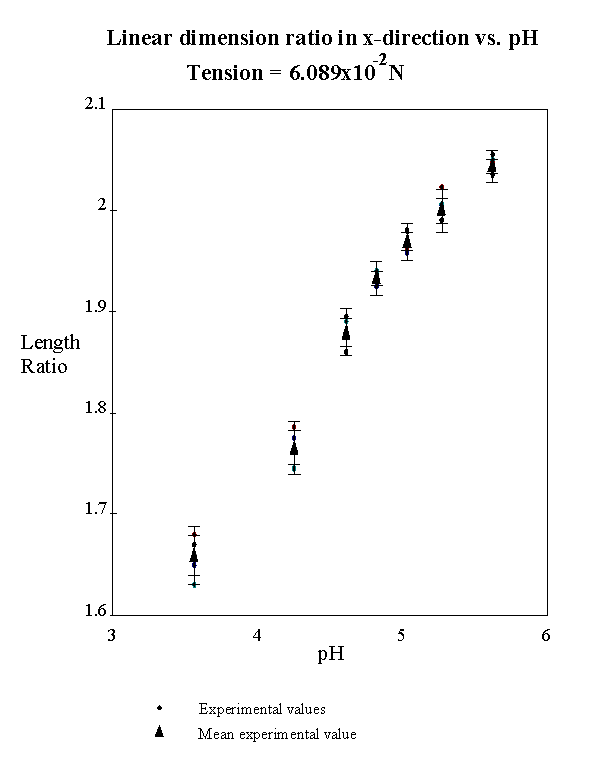
(a)
Figure 4.1 (a), (b): Length ratios in x and y direction under constant tension of 6.098 x 10⁻²N at various HCl content. The PVA-PAA gel film under constant tension was immersed in bath solution with various degree of HCl content for 24 hours, and the length ratios in x and y directions were measured. The standard deviations of measured values for each pH units were denoted by the vertical interval bars around the mean experimental values, and the additional measurement error interval bars were plotted at above and below the respective standard deviation intervals.
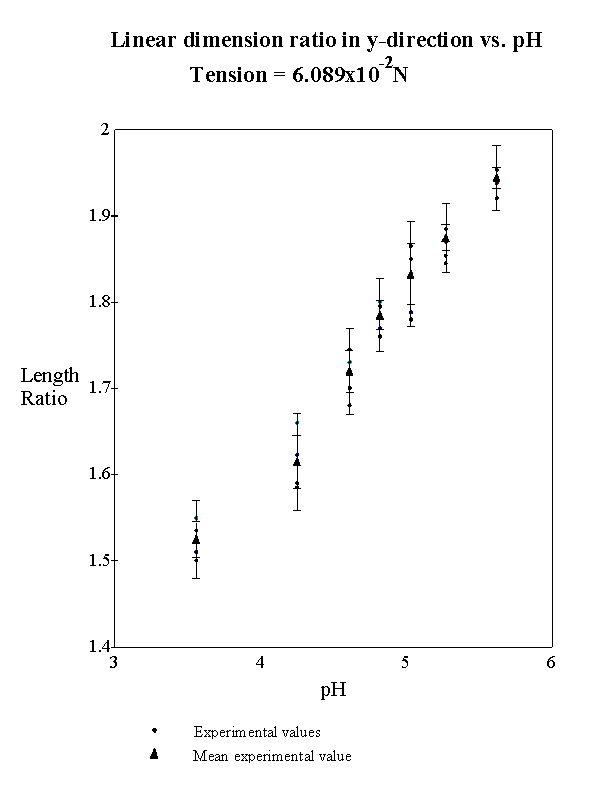
(b)
Figure 4.1 (a), (b): Length ratios in x and y direction under constant tension of 6.098 x 10⁻²N at various HCl concentration. The PVA-PAA gel film under constant tension was immersed in bath solution with various degree of HCl concentration for 24 hours, and the length ratios in x and y directions were measured. The standard deviation of measured values for each pH units is denoted by the vertical interval bars around the mean experimental values, and the additional measurement error interval bars are plotted at above and below the respective standard deviation intervals.
4.2.4 Model parameter estimation
Application of the electrolyte gel model requires three parameters to be estimated. They are the polymer-solvent interaction parameter, c, elastic modulus of the gel's elastomer, Ed, the "Poisson-like" ratio, n. For simplicity, we assumed these parameters were isomorphic, that is their values were the same in all direction. In addition, we assumed the parameters were solely a function of swelling in isothermal and isobaric conditions. Since the polymer-solvent interaction parameter for the poly-vinyl alcohol (PVA) gel has already been studied extensively by other researchers such as Sakurada, we will estimate the c values of PVA-PAA gel to be equal to that of PVA gel (Sakurada, 1959). This leaves us with only two parameters to be estimated, Ed and n. A root finding technique was employed to simultaneously solve the equations of the electrolyte gel's equilibrium model numerically, and based on trial and error, appropriate values of Ed and n were determined for each pH unit data (and corresponding swelling degree) from the constant tension experiment. Although the procedure was based on trial and error, it is worthwhile to note that there always was a unique set of Ed and n that matched each data set, and therefore, converging on the right value was relatively a simple process. The curves were fitted to the estimated values of Ed, n, and c with respect to the volume ratio, and the fitted curves along with the estimated parameters are plotted in Figure 4.2.
Although the detailed investigation of the thermodynamic and elastomeric properties of polymer gel is beyond the scope of this thesis, the general trend of the estimated parameters, especially the elastic modulus and the "Poisson-like" ratio, merit brief discussion. At low volume ratio, the elastic modulus was seen to stay constant with respect to increase in volume ratio whereas the "Poisson-like" ratio decreased. On the other hand, at high volume ratio of 6 and above, the elastic modulus increased sharply and the "Poisson-like" ratio in turn varied little with respect to change in the volume ratio. Interestingly, this trend seems to be in agreement with our general understanding of rubber elastomer.
The rubber elastomer is considered to be a non-linear spring which tends to have very low Young's modulus under low elongation, but it stiffens sharply when highly elongated.
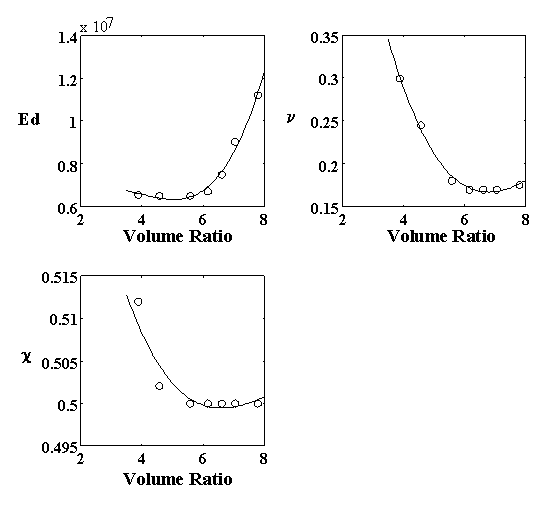
Figure 4.2: Estimated values of PVA-PAA's Ed, n, c versus the volume ratio. The polymer-solvent interaction parameter, c, was estimated to be equal to that of PVA gel, which has been studied extensively by other researcher already. The values of elastic modulus, Ed and "Poisson-like" ratio, n, were estimated by simultaneously solving the PVA-PAA gel's equilibrium conditions numerically.
This is because its deformation consists essentially of uncoiling the molecules in a crosslinked network. Under the highly elongated state, however, most of the uncoiling has already taken place, and significantly more energy is required for further deformation. Therefore, its modulus increases sharply at highly elongated state, and the estimated value of the PVA-PAA's elastic modulus seems to fit this explanation very well since increasing volume ratio implies increasing elongation of each elastomer unit.
On the contrary, the explanation for the decreasing trend of the estimated values of the "Poisson-like" ratio with respect to increase in the swelling degree is not as obvious. Although the thermodynamic effect of rubber elasticity on gel's swelling has been studied extensively by numerous researchers, there is little work done on the investigation of the Poisson effect specifically for gel swelling. Nonetheless, considering that the Poisson ratio for solid elastomer is 0.5, it seems to be intuitive enough that the overall "Poisson-like" ratio should decrease as the elastomer is dispersed in the solvent, thereby decreasing the effective intersecting joint region of the elastomer units. In order to draw a substantial conclusion, though, further investigation of elastomer mechanics would be necessary.
4.2.5 Model result
Constant tension test
With the assumption that the parameters Ed, n and c are functions of volume ratio (swelling degree) only, the equations representing the PVA-PAA gel's equilibrium swelling condition are also reduced to functions of volume ratio only as well. Utilizing the curve fits of the estimated parameters of Ed, n and c as well as the estimated parameters themselves from the previous section, the gel's theoretical length ratios in both x and y directions were calculated based on the equilibrium swelling model. The resulting model was applied to the free swelling situation as well as to the situations where the tensile forces were 6.089 x 10⁻² N and 8.528 x 10⁻² N, and the predicted values were compared to the actual experimental results. The experimental results of length ratios for the free swelling and 8.528 x 10⁻² N tensile force cases were
Buffer : HCl Ratio
|
100:2 |
100:4 |
100:6 |
100:8 |
100:10 |
100:13 |
100:16 |
|
|
a |
1.95 |
1.89 |
1.86 |
1.81 |
1.76 |
1.65 |
1.55 |
Free swelling experiment
Buffer : HCl Ratio
|
100:2 |
100:4 |
100:6 |
100:8 |
100:10 |
100:13 |
100:16 |
|
|
a x |
2.07 |
2.04 |
2.00 |
1.97 |
1.93 |
1.82 |
1.73 |
|
a y |
1.93 |
1.86 |
1.82 |
1.77 |
1.70 |
1.60 |
1.51 |
Constant tension experiment (Tension = 8.528 x 10⁻² N)
and they are plotted against the model predicted values in Figures 4.3, 4.4 and 4.5. The standard deviations of the measured values for the free swelling case ranged from 0.011 to 0.026 whereas for the 8.528 x 10⁻² N tensile force case, the standard deviations ranged from 0.006 to 0.015 and 0.013 to 0.026 for x and y directions, respectively. The ranges of measurement error in linear dimension ratio were ![]() and
and ![]() for x and y axis, respectively. It should be noted that the particularly large standard deviation of the measured values for the most contracted case of free swelling test should be attributed to the method of force transmission cable attachment. The ends of the gel samples were clamped by the termination blocks at the middle of its swelling range, i.e., buffer to HCl ratio of 100:8, and therefore, the lateral stress of the gel near the termination block would be significant, especially at the most contracted state. Subsequently, this termination effect would have significant influence on the measured axial length ratio at the most contracted state. For the case of free swelling, the gel samples were measured both with and without the termination block clamped on (to represent the gel with high length to width ratio, in which case the termination effect will be minimal), and this largely accounted for the larger than usual deviations of measured values from the mean.
for x and y axis, respectively. It should be noted that the particularly large standard deviation of the measured values for the most contracted case of free swelling test should be attributed to the method of force transmission cable attachment. The ends of the gel samples were clamped by the termination blocks at the middle of its swelling range, i.e., buffer to HCl ratio of 100:8, and therefore, the lateral stress of the gel near the termination block would be significant, especially at the most contracted state. Subsequently, this termination effect would have significant influence on the measured axial length ratio at the most contracted state. For the case of free swelling, the gel samples were measured both with and without the termination block clamped on (to represent the gel with high length to width ratio, in which case the termination effect will be minimal), and this largely accounted for the larger than usual deviations of measured values from the mean.
Salt content test
The PVA-PAA gel's equilibrium swelling model with the estimated parameters Ed, n and c was also applied to the NaCl salt content test situations, and the model predicted values are plotted against the experimental actual values in Figure 4.6. The standard deviation of measured values was roughly around 0.013 consistently, and the range of measurement error in linear dimension ratio was ![]() .
.
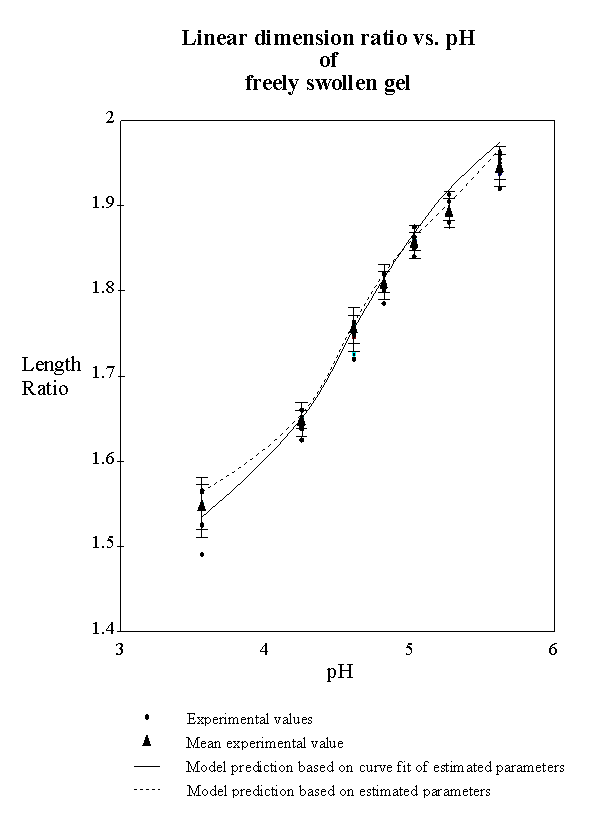
Figure 4.3: Linear dimension ratio vs. pH of freely swollen PVA-PAA gel strip. The PVA-PAA gel strips were freely swollen in solutions with various degree of HCl content, and the equilibrium dimension ratios were measured. The results are plotted against the model predicted values represented by the continuous curves.
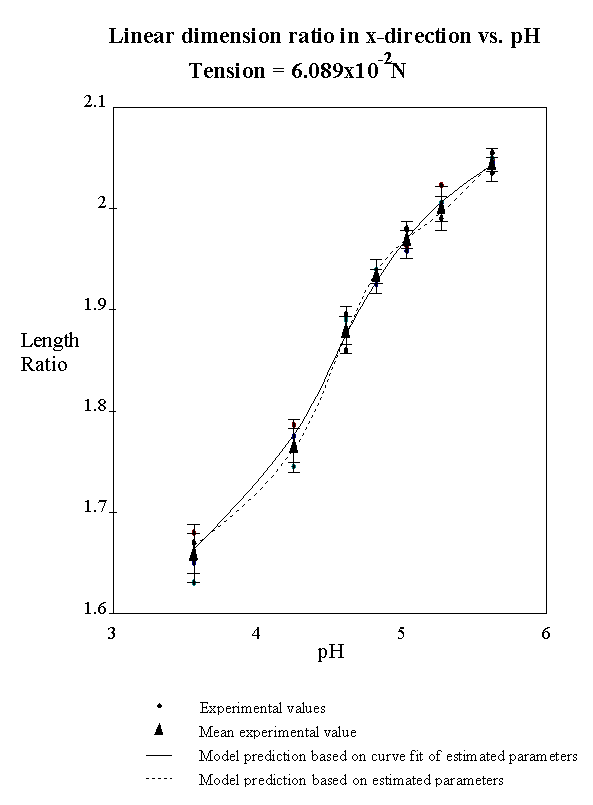
(a)
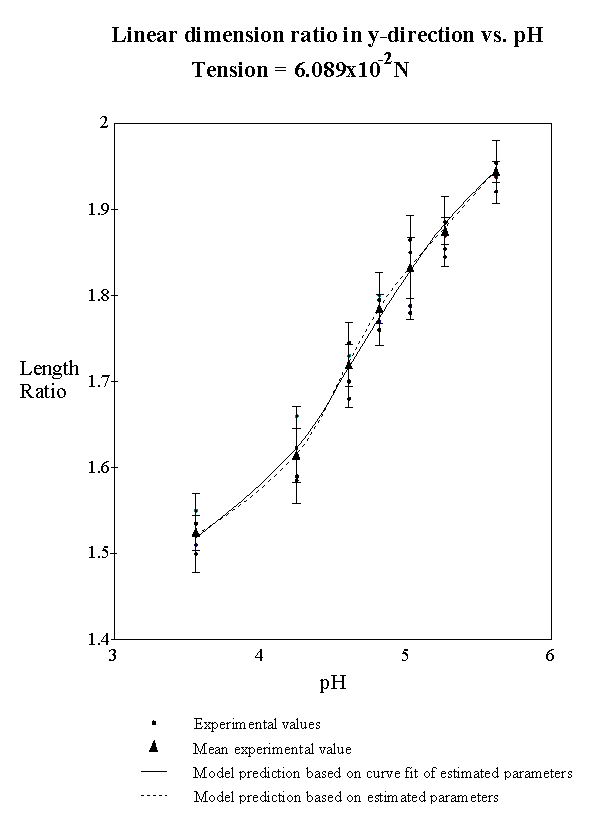
(b)
Figure 4.4 (a), (b): Linear dimension ratio vs. pH of PVA-PAA gel strip under constant tension of 6.089x10⁻² N. Since the applied tension was the calibration tension employed for estimating the parameters Ed, c and n , the model predicted values (continuous curves) closely matched the experimental results as expected.
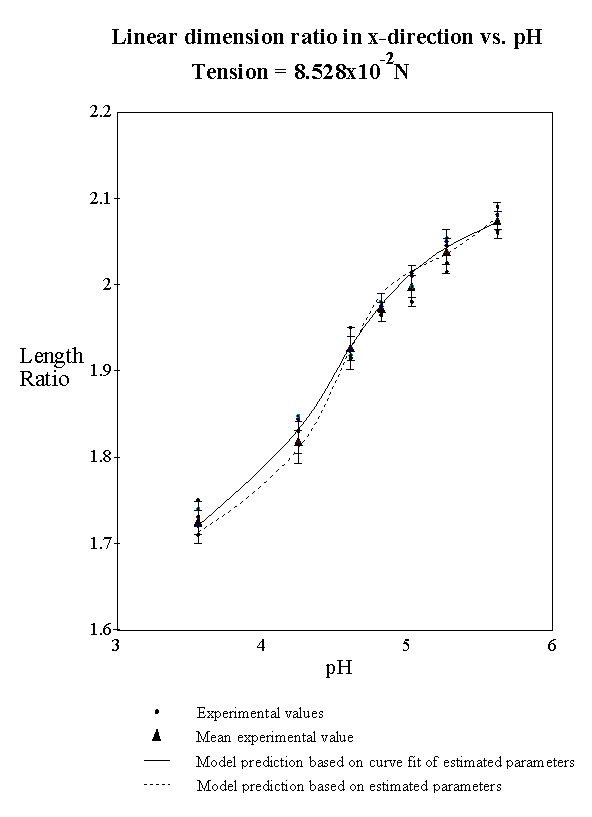
(a)
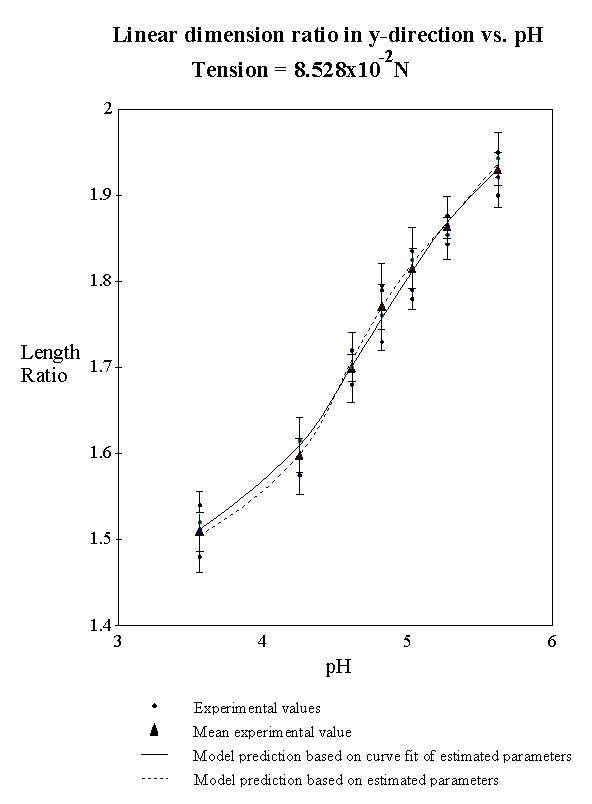
(b)
Figure 4.5: Linear dimension ratio vs. pH of PVA-PAA gel strip under constant tension of 8.258x10⁻² N. The experimental results are plotted against the model predicted values (continuous curves).
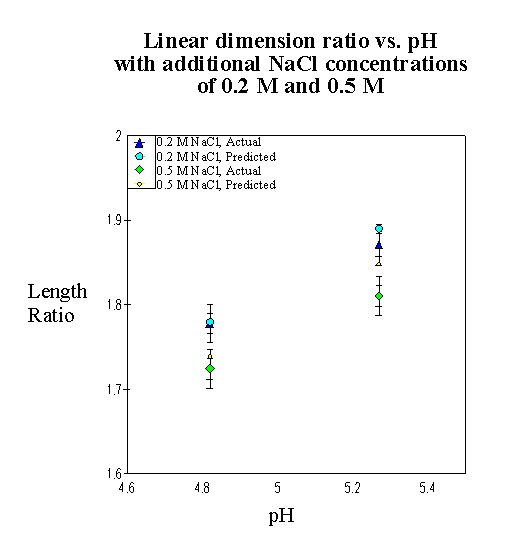
Figure 4.6: Linear dimension ratio vs. pH of PVA-PAA gel strip with additional salt content. The PVA-PAA gel's equilibrium swelling model was applied to the situation where the bath's NaCl contents were increase by 0.2 M and 0.5 M. The model predicted and experimental values are compared.
4.2.6 Discussion
Constant tension test
As shown in the figures above, the equilibrium swelling model for electrolyte gel successfully predicted the swelling degrees of PVA-PAA gel in acetate buffer bath solution with various pH's and tensile loads. In general, the model's predictions were within the standard deviations of the actual values in linear dimension ratios, except for the highly swollen region (of pH 5 and above) of the free swelling case where it over-predicted up to 0.03 from the mean value of the experimental results. (The model prediction based on the estimated parameters themselves still resulted within the error margin ![]() of the actual mean value, where as the predicted value based on the curve fit of the estimated parameters over-predicted slightly more.) This over-prediction at the highly swollen state is suspected to be due to the model's simplifying assumption that the estimated parameters Ed and n are orientation independent and depend on the swelling degree alone. In other words, we are assuming that the elastomer units in all three axis share common "average" values of Ed and n at any point in time. Although this is a reasonable simplifying assumption, it is clearly not the actual case. As the gel is uniaxially tensed, the elastomer unit oriented axially would experience much higher elongation than the other units, and therefore the "actual" elastic modulus of this particular units would be higher than the "average" value. Conversely, the "actual" elastic modulus of the units oriented perpendicular to the tensile force would be lower than the "average" value. Since the parameters were estimated with the calibration tensile loading of 6.089 x 10⁻² N, the model prediction error is therefore expected to be higher for free swelling case, especially at the highly swollen region where the polymer network is uncoiled and the elastic modulus is sensitive to further elongation. A more accurate model would include separate mechanical parameters along each orientation. However, this would overly complicate the analysis, and the benefit of the simplifying assumption far outweighs the cost in this case. Furthermore, it should be noted that even the errors of up to 0.03 in linear dimension ratios that one gets with simplifying assumption are still only up to 6 percent of the gel acutator's total stroke range, and further improvement in accuracy should be easily done with closed loop feedback control implementation.
of the actual mean value, where as the predicted value based on the curve fit of the estimated parameters over-predicted slightly more.) This over-prediction at the highly swollen state is suspected to be due to the model's simplifying assumption that the estimated parameters Ed and n are orientation independent and depend on the swelling degree alone. In other words, we are assuming that the elastomer units in all three axis share common "average" values of Ed and n at any point in time. Although this is a reasonable simplifying assumption, it is clearly not the actual case. As the gel is uniaxially tensed, the elastomer unit oriented axially would experience much higher elongation than the other units, and therefore the "actual" elastic modulus of this particular units would be higher than the "average" value. Conversely, the "actual" elastic modulus of the units oriented perpendicular to the tensile force would be lower than the "average" value. Since the parameters were estimated with the calibration tensile loading of 6.089 x 10⁻² N, the model prediction error is therefore expected to be higher for free swelling case, especially at the highly swollen region where the polymer network is uncoiled and the elastic modulus is sensitive to further elongation. A more accurate model would include separate mechanical parameters along each orientation. However, this would overly complicate the analysis, and the benefit of the simplifying assumption far outweighs the cost in this case. Furthermore, it should be noted that even the errors of up to 0.03 in linear dimension ratios that one gets with simplifying assumption are still only up to 6 percent of the gel acutator's total stroke range, and further improvement in accuracy should be easily done with closed loop feedback control implementation.
Salt content test
Although the equilibrium swelling model managed to predict the PVA-PAA gel's actual behavior in acetate buffer bath with high salt content with accuracy within the error margins in general (except for the 0.5 M NaCl at pH 5.27 case where the model prediction deviated from the mean experimental value by 0.04), we observed two trends that need further discussion. First, it was observed that the model performance degraded as the salt concentration was increased, and secondly, the model predicted the gel swelling at contracted state better than at swollen state.
The first trend, the degradation of model performance with increase in salt concentration, can be attributed to the fundamental limitation of the modeling assumption; treatment of ions as in dilute solution. While the dilute solution assumption of ions is a reasonable or even essential simplifying assumption in order to result in tractable model, it can be clearly seen that the validity of this assumption starts to break down at high concentrations of Na+ and Cl- ions. For instance, as shown in Figure 4.6, for 0.2 M NaCl case, the model predicted the actual behavior reasonably well. However, for 0.5 M NaCl case, especially at high pH region, the model failed to predict the actual behavior within the error margin. (There is also a possibility of Na+ ion binding to the carboxyl side group due to high Na+ ion concentration on the contrary to our modeling assumption, and in such case, the gel's swelling degree would be affected as well. However, based on other researchers' work, Na+ is not likely to bind to the carboxyl groups in any significant amount. Further investigation would be necessary to rule out this possibility completely, though.)
Secondly, the degradation of model performance with increase in bath pH (and thus the gel's swelling) can be attributed to the ionization of the gel's fixed charges which is carboxyl group in our PVA-PAA gel case. The carboxyl group attached to the polymer network of the PVA-PAA gel acts as an weak acid with pKa of 4.89 (according to DeRossi). Therefore, the carboxyl group will be mostly in ionized state at internal pH above its pKa value whereas it will be in neutral state at internal pH below the pKa value. (Exactly half of the total carboxyl group will be in ionized form when the internal pH is equal to the pKa value.) In fact, this ionization process of the carboxyl group is one of the main forces in causing the ionic gel to swell and contract under varying pH, and this explains why the model will better predict the actual behavior under low pH when the salt content is high. Under low pH region (and thus contracted state), most of the carboxyl groups are in neutral form, and therefore, the effect of salt ion concentrations are kept minimal. However, as the pH is increased, more of the carboxyl groups are transformed into ionized state, in which case the effect of ion concentrations on the gel's swelling behavior is significant (Donnan effect), and subsequently, the model predictability would become increasingly sensitive to the deviation of ions' modeling assumption from the actual case as discussed above. In order to overcome this limitation in modeling assumption, one may choose to employ the ions' activities rather than the mole fractions in the model. However, the activities are empirical values which are not easy to obtain, and the usability (and thus the value) of the resulting model may be significantly undermined. Nonetheless, one should also note that when using the actuator prototype system as to be described later where both HCl and NaOH were employed to modulate the bath pH, the salt content of the surrounding bath hardly exceeded the concentration of 0.2 M even after numerous full stroke cycles, and therefore, the model prediction's deviation from the actual behavior at high salt content does not seem to be of great concern for our case.
4.3 Swelling kinetics model verification
For the case of PVA-PAA gel swelling in acetate buffer solution, there are minimum of six coupled independent dynamic equations of electrolyte gel model representing the swelling process: four for each ion species' chemical capacitance, one for the electric potential capacitance and one for the solventís chemical capacitance. (We have not attempted to represent the dynamic model of PVA-PAA gel in acetate buffer solution using the bond graph formalism due to complexity.) If one desires to model more than one bulk unit, the order of complexity would increase as well, and obviously, this is already much more complicated than desired. Therefore, as we've discussed before, we first started by identifying the rate limiting process experimentally, and then we reduced the overall dynamics to the first order coupled differential equation.
Grodzinsky has shown that for ionic gels, the limiting process can be either the ions' diffusion-limited reaction process or the mechanical readjustment process. For instance, DeRossi (1988) has shown that the PVA-PAA gel's swelling rate in the aqueous solution (with the pH modulated by HCl) is limited by diffusion-limited reaction of H+ ions with the gelís negatively charged carboxylic side groups. However, this may not be the case with the acetate buffer bath solution due to the high concentration of acetic acid buffer molecules present within the gel. Depending on the internal pH of the gel, the acetic acid can readily give up the H+ ion, acting as the potential source of hydronium ions, and in such case the overall kinetic is not limited by the diffusion of H+ ion. In fact, Grimshaw has reported a significant increase in gel's kinetics when the bath solution contained high concentration of buffer. Therefore, the limiting process for our situation needs to be experimentally identified, and the procedure is described in following section.
4.3.1 Limiting process identification procedure
According to Grodzinsky, the polymer gel's swelling kinetics may be measured by observing the transient force or transient swelling developed by the gel, and this method was employed to measure the kinetics of PVA-PAA gel's swelling. Although Grodzinsky has demonstrated this technique only on gel compression test, we assumed it would hold as well for tension test.
In order to identify the mechanical readjustment rate from the diffusion-limited reaction rate, two sets of experiments were performed: the incremental pH reduction test and the stress relaxation test. Experimental apparatus was built to conduct both sets of experiments, and its schematic is shown in Figure 4.7. It consisted of a test chamber, a linear stage, a loadcell, associated electronics and a computer. The chamber was constructed from Plexiglas, and mounted on the test chamber's extension was a Daedelus linear stage (stage: 1" travel, 0.001" readable increment). The PVA-PAA gel strip with the transmission cables mounted were placed in the test chamber of the acetate buffer solution, and the stirring bar continually circulated the bath solution to ensure the uniformity. One end of the gel strip was fixed to the test bed, and the other end of the gel was mounted via the transmission cable to the load cell, which in turn was mounted on the linear stage. The tension was applied to the gel strip by simply moving the linear stage away from the gel. The load cell was connected to amplifying electronics and the output voltage was sent to the data acquisition system in a 33MHz 386 IBM compatible computer.
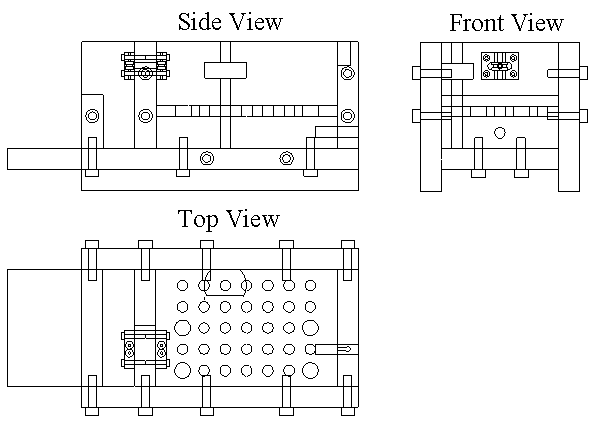
Test chamber schematics
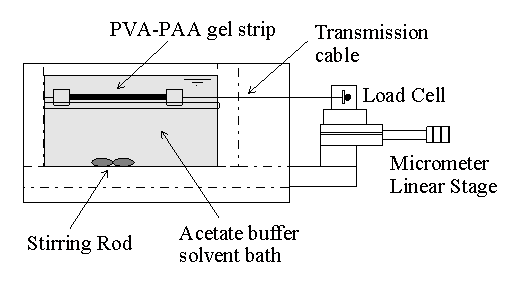
PVA-PAA gel strip mounted on the experimental apparatus
Figure 4.7: Schematics of the gel swelling kinetics test setup. Experimental apparatus is consisted of a test chamber, a linear stage, a load cell, associated electronics and a computer.
Incremental pH reduction test
Starting with slightly pretensed PVA-PAA gel strip equilibrated with bath solution of various initial pHs, the bath pHs were reduced incrementally as described by Grodzinsky, and the transient tensile force developed by the PVA-PAA gel strip were recorded. Since the gel's tensile force development following each pH reduction was driven by ion diffusion into the gel, the kinetics could be limited by either the ion diffusion process (due to diffusion-limited reaction of H+ ions) itself or the mechanical readjustment of the polymer network. Therefore, one can not identify the limiting process by the incremental pH reduction test alone. However, together with the stress relaxation test, our goal can be achieved.
Stress relaxation test
For wide range of different pH's, the PVA-PAA gel strip under initial tension was further stretched incrementally while maintaining the constant bath pH, and the transient tensile stress relaxations were recorded. As the gel is stretched, the osmotic pressure of the gel's interstitial fluid is decreased with respect to that of external bath, causing the solvent flow into the gel. Subsequently the interstitial fluid and the polymer network within the gel were redistributed and tensile stress of the gel was relaxed. Although the stress relaxation process involved increase in fluid content of the gel, we assumed its magnitude was rather small and its effect on the internal ion concentrations was negligible. Under this assumption, the ion diffusion process is then unimportant, and the overall rate of stress relaxation process is solely limited by mechanical readjustment. By comparing the kinetics of the incremental pH reduction test and the stress relaxation test for each bath pH level, we were able to identify the overall limiting process in gel swelling at each bath pH.
4.3.2 Experimental result
Typical experimental results of the incremental pH reduction test and the stress relaxation test were as shown in Figure 4.8, and the time constants of each test result were plotted with respect to the corresponding bath pHs in Figure 4.9. The time constant results for the incremental pH reduction test ranged from around 90 seconds to 150 seconds whereas for the stress relaxation test, it ranged from around 40 seconds to 120 seconds.
To our surprise, the gel's kinetics from both sets of experiments were in similar ranges regardless of the bath pH, and this implied that the mechanical readjustment was the limiting process for the tested bath pH ranges, and the ion diffusion (i.e., diffusion-limited reaction) must be occurring as fast as or faster. This result greatly simplified the electrolyte gel model to a first order dynamics as described in the following section.
Furthermore, although the variance of test results were too large to draw a definitive conclusion, note that the stress relaxation rate seems to be slightly increasing as the bath pH is increased.
4.3.3 PVA-PAA gel dynamic model
With the mechanical readjustment as the limiting process in PVA-PAA gel's swelling in acetate buffer solution, the overall dynamics may be simplified to a first order dynamics where the gel's interstitial ionic states are assumed to be always in equilibrium and the only kinetic process is the solvent flow into the gel driven by the osmotic pressure gradient. The governing equations are summarized below.
The equilibrium conditions are

![]()

![]()
![]()

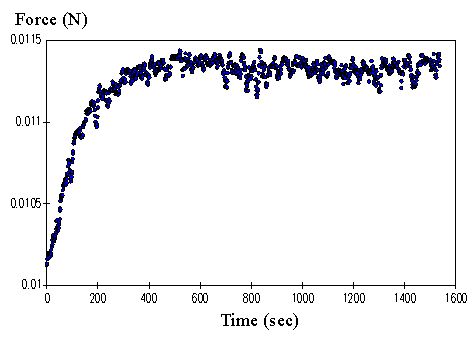
Typical response of incremental pH reduction test
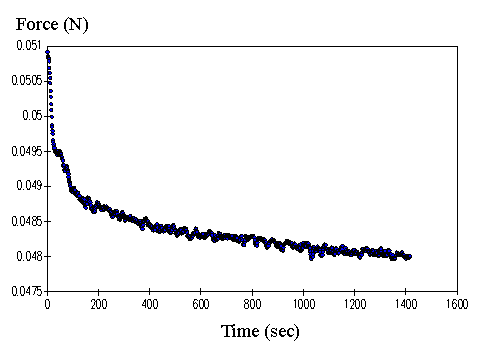
Typical response of stress relaxation test
Figure 4.8: Typical responses of the incremental pH reduction test and the stress relaxation test. Note that the response rates from both test are close to each other, implying a common limiting process.
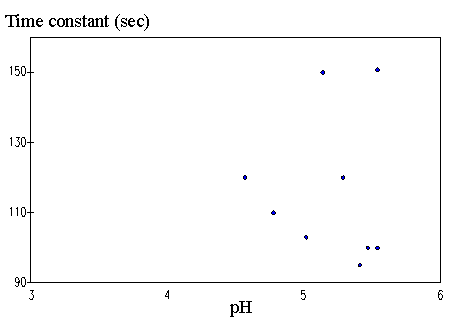
Force development time constant versus pH for incremental pH reduction test.
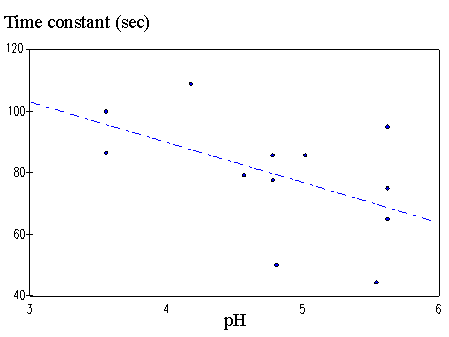
Stress relaxation time constant versus pH.
Figure 4.9: Time constant versus bath pH. The time constants from the incremental pH reduction test and the stress relaxation test responses are plotted against the bath pH. Both tests yielded similar range of time constants, and therefore, the mechanical readjustment was concluded to be the limiting process regardless of the bath pH. This finding greatly simplified the model to a first order dynamics. In addition, note the stress relaxation process tends to speed up as pH is increased.

![]()
and the dynamic equation is
![]()
where
![]()


![]()

4.3.4 Model simulation and discussion
The above first order dynamic model of the actual PVA-PAA gel sample with the mechanical readjustment as the limiting process was numerically simulated for both the incremental pH reduction and the stress relaxation cases, and the simulation results for the most expanded and most contracted cases, i.e., the acetate buffer to HCl ratios of (100:2) and (100:16), are shown in Figures 4.10, 4.11 and 4.12. (0.6 nm was used as the polymer network model's cylindrical fiber radius, a for the simulations.) According to the simulation results, the predicted time constants for the most expanded and the most contracted cases were around 50 and 230 seconds respectively, providing the upper and lower bounds for PVA-PAA gel's swelling kinetics. In general, the time constant predicted by model decreased with swelling, and although the speed increase is not as pronounced as in the simulation results, the actual experimental results from the stress relaxation test (Figure 4.9) also showed similar trend. According to Grodzinsky and Tanaka, this behavior can be attributed to the combined effect of the increase in gel's solvent permeability and decrease in longitudinal modulus with swelling. The increasing permeability effect tends to speed up the swelling process significantly. However, as the gel swells, its longitudinal modulus decreases and consequently, it tends to slow down the swelling process. The overall effect is due to the combination of these two effects, and for our PVA-PAA gel, the net effect was a slight increase in gel kinetics with swelling. (Grodzinsky has also observed similar behavior with the poly-(methacrylic acid) (PMAA) hydrogels.)
Furthermore, the gel's dimensional effect on the model prediction was briefly investigated. According to Tanaka, the gel's stress relaxation time constant is proportional to the square of the characteristic dimension, which is the gel's thickness in the case of flat thin strip. The electrolyte gel's dynamic model was simulated for the buffer to HCl ratio of (100:16) case where the gel's dry thickness is half of the original thickness. As shown in Figure 4.13, the simulation predicted about four times faster kinetic than the original thickness case, resulting in time constant of around 60 seconds, and this simulation result is in exact agreement with Tanaka's finding. In conclusion, the electrolyte gel model for PVA-PAA gel in acetate buffer based solution successfully predicted the actual gel's behavior.
In addition, it is interesting to note that in Figure 4.12, the experimental results in pH 3.56 case seem to show existence of two separate dynamics, causing fast initial drop of tensile force followed by a slower decrease. It is suspected that this can be attributed to the uneven stress loading of the gel strip at the termination region, especially at contracted state. Due to the imperfection of termination scheme, small portion of the gel may have been stretched much more than the rest, carrying much of the total load, and in such case, as the gel is further stretched, this small region may undergo faster stress relaxation process than the rest, resulting in sudden initial drop of stress. In order to draw definite conclusion of the cause, however, one needs to develop a better termination scheme to evenly distribute the loading, and the highly tensed small region may be separately modeled rather than relying on a single bulk unit model. In fact, as the gel sample's thickness increase or as the stress loading becomes increasingly uneven, the spatial as well as the temporal description of the swelling gel's state would be necessary, and the lumped parameterized (low number) bulk unit model approach is expected to be less valid, and one would be forced to employ finer unit model, approaching the continuum model.
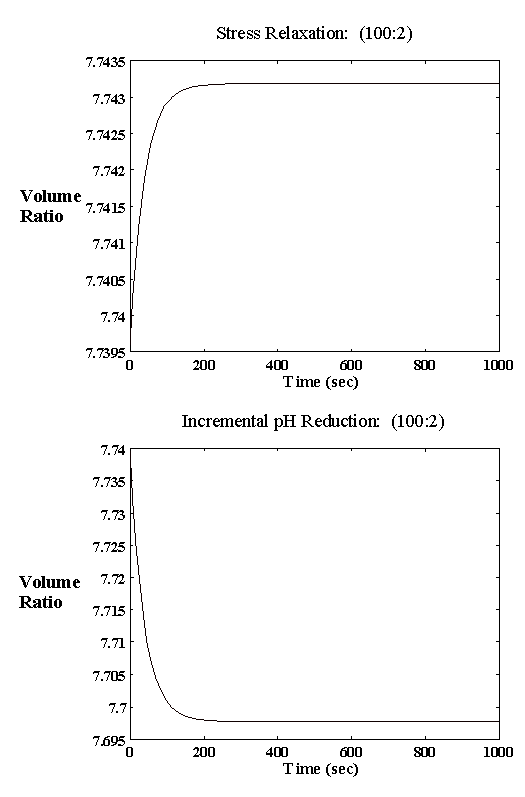
Figure 4.10: Simulation results of volume ratio's transient responses for the acetate buffer to HCl ratio of 100:2. The stress relaxation and the incremental pH reduction tests cases were numerically simulated with cylindrical fiber radius of 0.6 nm, and the time constant of the results were around 50 seconds.
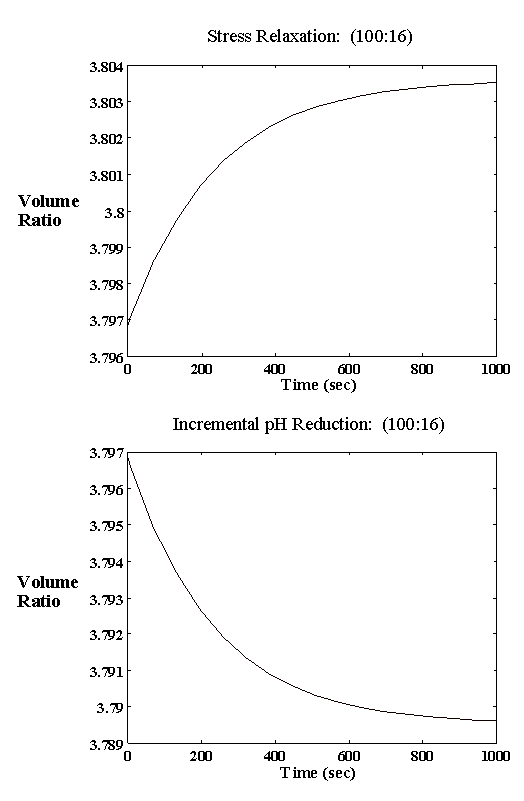
Figure 4.11: Simulation results of volume ratio's transient responses for the acetate buffer to HCl ratio of 100:16. The stress relaxation and the incremental pH reduction tests cases were numerically simulated (a = 0.6 nm), and the predicted time constants were around 230 seconds. In general, the time constants predicted by simulations decreased with swelling, which is in agreement with the general trends observed from experimental results.
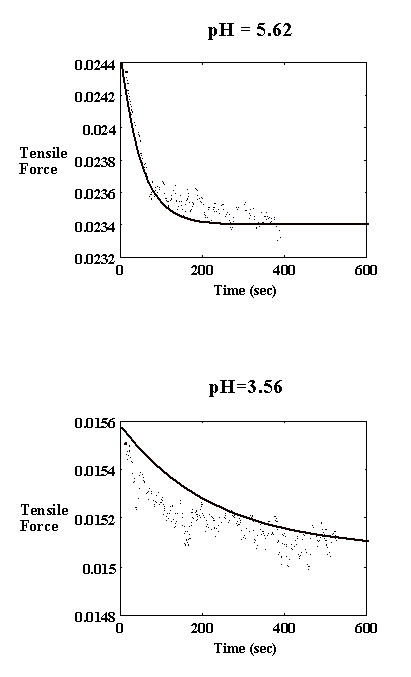
Figure 4.12: The stress relaxation tests were numerically simulated (a = 0.6 nm), and the predicted transient responses are plotted against the experimental results for both the most swollen and most contracted cases.
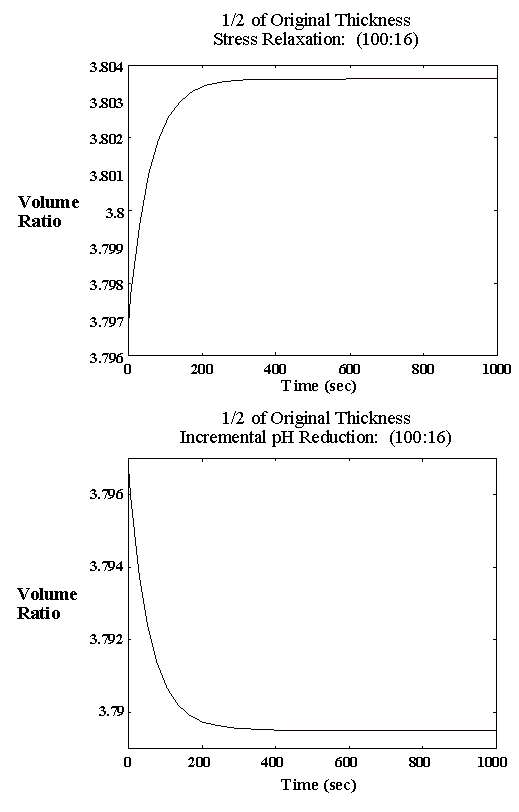
Figure 4.13: Simulation results of volume ratio's transient responses for the acetate buffer to HCl ratio of 100:16. The gel with dry thickness of half the original thickness was simulated, and the predicted time constants were about one fourth that of the original thickness case, which was about 230 seconds (Figure 4.11). This agreed exactly with Tanaka's model.
Chapter 5
Implementation
5.1 Demonstration actuator device
For the purpose of demonstrating the PVA-PAA gel's model in real-time control, a computer controlled prototype actuator and supporting devices were built. The actuator system consisted of the actuator package, loadcell, optical encoder, fluid flowrate sensors, solenoid valves, a positive displacement peristaltic pump, associated electronics and a computer. Since the controllability of the gel actuator entirely relies on the ability to accurately control the ion concentrations of the surrounding bath, the basic design was focused on the building a system with 1) self containment, 2) minimum fluid leakage to outside, 3) minimum friction, and 4) accurate injection of activating chemicals into the system (one molar HCl and NaOH in this case). The schematics of the actuator package and the supporting devices are shown in Figure 5.1. The PVA-PAA gel unit is situated inside the actuator package which is a part of a closed fluid circuit. One end of the gel unit is mounted on the stationary load cell, and on the other end, a weight is hung applying tension to the gel unit. The length of the gel unit is monitored via the optical encoder mounted on the pulley.
There are three fluid paths in the system: acid, base and surrounding bath paths. Fluid in all three paths are continuously circulated at constant rate, and the flow meters continuously measured the acid and base paths' flow rates. At normal setting, the three way solenoid valves are set to direct the activating (acid and base) fluid flow back to the reservoirs, disconnecting the surrounding bath path from either the acid or base paths, and the valve at the waste spout is closed. To inject the acid or base into the surrounding bath, the corresponding three way solenoid valve is switched to direct the activating fluid into the surrounding bath path rather than back to the reservoir, and at the same time, the valve at the waste spout is opened to displace the equal amount of the bath solution as of the injected activating fluid. The duration of valve switching is determined based on the desired volume to be injected and the current flow rate as measured by the flow meters, and the resulting accuracy in fluid injection is within 5% error which translates into additional ![]() possible error in length ratio. The ion concentrations of the bath solution after the injection are calculated based on the assumptions that the solution purged during injection has volume exactly equal to that of the injected fluid and the purged solution consists of preexisting solution only. The bath solution was continuously circulated through the mixing chamber to ensure the uniformity of ion concentrations.
possible error in length ratio. The ion concentrations of the bath solution after the injection are calculated based on the assumptions that the solution purged during injection has volume exactly equal to that of the injected fluid and the purged solution consists of preexisting solution only. The bath solution was continuously circulated through the mixing chamber to ensure the uniformity of ion concentrations.
The control software was written in Visual Basic for Microsoft's Windows. In addition to basic hardware control functions such as valve switching and sensor readings, it also determined the necessary amount of activating fluid to be injected based on the PVA-PAA's electrolyte gel model in real-time. In general, a feed-back closed-loop controller which compensates for the error would improve the system's performance, especially in the presence of external disturbances. However, only the feed-forward closed-loop controller without any error compensation is employed at this time to isolate the performance result due to the model only. Sensor calibration routines were integrated into the user interface, and the user interface is shown in Figure 5.2.
5.2 Results
The PVA-PAA gel based actuator system demonstration device was experimentally tested, and it yielded excellent desired position tracking ability as shown in Figure 5.3. Starting at a fully swollen state in the acetate buffer solution of pH 7, the controller was commanded to track the PVA-PAA gel strip's desired axial length ratios of 1.8 followed by 1.65 and 1.95 (shown as solid lines in the plot). During the course of the experiment, the tensile load was randomly changed at various points in time by hanging different weights, and the controller was command to make necessary adjustment. As results, the system tracked the desired length ratios well within the expected error margin of ![]() (shaded region), which includes the possible error due to instrumentation and irrigation scheme as well. In addition, the time constants of the transient responses were around one minute, which is considerably slower than the response time from either stress relaxation or incremental pH reduction tests, due to slow mixing of irrigation system. A faster irrigation system should be able to increase the speed up the characteristic response time of the gel which is under 200 seconds. As far as the tracking performance is concerned, the result was highly satisfactory for the feed-forward control implementation, and even better results are expected when combined with error compensating feed-back control loop.
(shaded region), which includes the possible error due to instrumentation and irrigation scheme as well. In addition, the time constants of the transient responses were around one minute, which is considerably slower than the response time from either stress relaxation or incremental pH reduction tests, due to slow mixing of irrigation system. A faster irrigation system should be able to increase the speed up the characteristic response time of the gel which is under 200 seconds. As far as the tracking performance is concerned, the result was highly satisfactory for the feed-forward control implementation, and even better results are expected when combined with error compensating feed-back control loop.
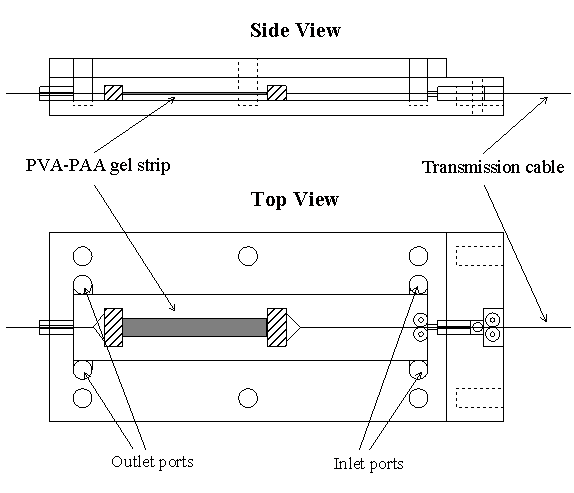
Schematic of actuator package
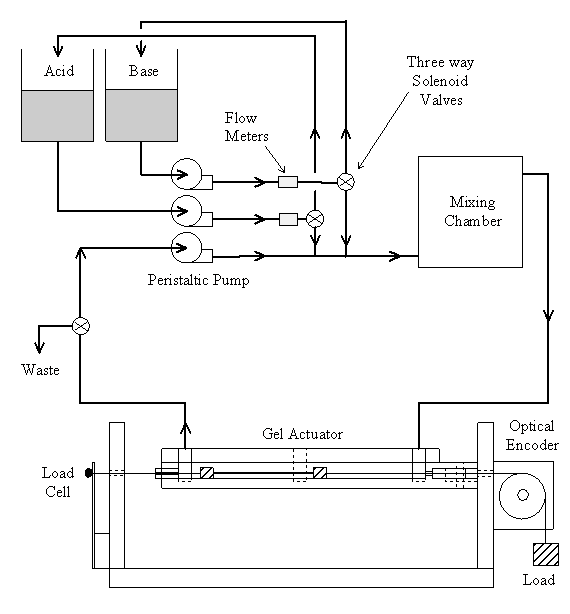
Figure 5.1: Schematics of the actuator package and the support system.
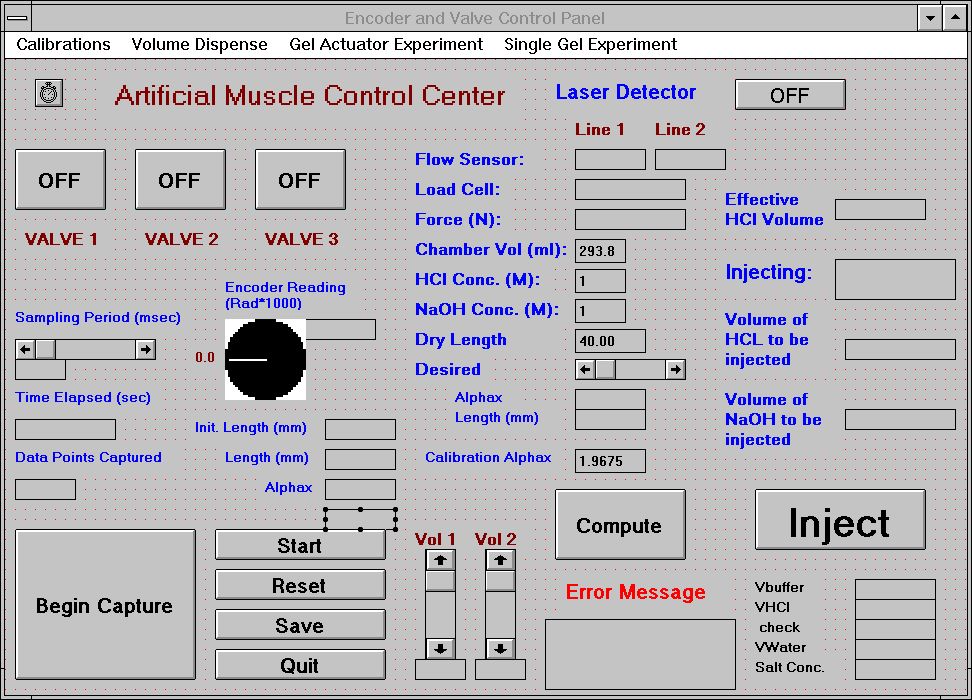
Figure 5.2: Computer control system's user interface. The software was written in Microsoft's Visual Basic for Windows. The control software determined the necessary amount of activating fluid to be injected by numerically solving the PVA-PAA gel's model in real-time.
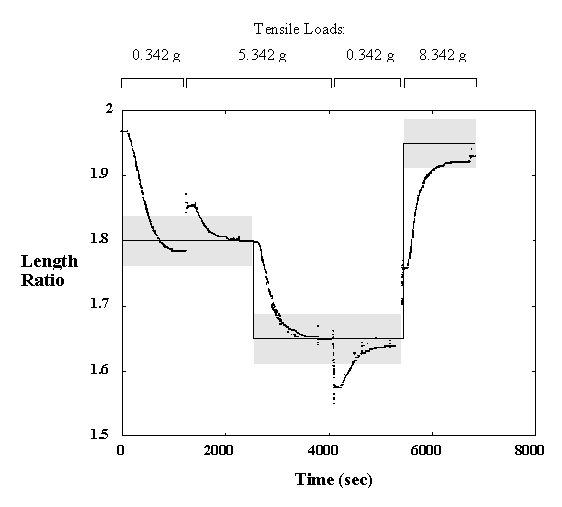
Figure 5.3: PVA-PAA gel actuator system's desired length ratio tracking performance. The feed-forward controller was commanded to track the desired axial length ratios shown in solid lines. During the course of experiment, the tensile load was randomly varied, and the controller successfully compensated for the external disturbances. The shaded regions are the expected error margin of ![]() .
.
Chapter 6
Conclusion
6.1 Review
"Artificial muscle" based on polymer gel has received wide attention as a potential alternative actuation technology. Unlike the electric motor which possesses inherent limitations of size, complex transmissions and restrictive geometry, the polymer gel based actuator has the potential to overcome these limitations. This contractile compliant "muscle" would be analogous to a human muscle, driven by chemical, thermal or electric signals. Its speed and strength are comparable to human muscle, and its potential impact on the design of devices such as robotics manipulators, prosthesis and surgical tools could be phenomenal. However, in order to make the polymer gel based actuation more than just a laboratory curiosity, much work needs to be done in various areas such as the supporting mechanics, stimulation method, energy storage system, power delivery technique, packaging method, static/dynamic model and control system. Among these, availability of a thermodynamically correct simple static/dynamic model of polymer gel would greatly enhances the investigations of the rest of the issues, especially the real-time control system. Therefore, I have chosen to develop the lumped parameter model of polymer gel suitable for real-time control system in this thesis. I first investigated the polymer gel model for non-electrolyte gel and extended the result to electrolyte gel case. The electrolyte gel model was then applied to the poly(vinyl Alcohol)-poly(acrylic acid) (PVA-PAA) gel in acetate buffer solution, and its static and dynamic results were experimentally verified. As a demonstration, the model was incorporated into a real-time control system of prototype actuator system.
Non-electrolyte gel model
The control volume surrounding the polymer gel network and interstitial solvent fluid was considered. The modeling assumptions were: (1) relatively slow process, (2) solvent diffusion-limited, (3) inertial and convection effects negligible, (4) quasistatic, (5) isothermal, (6) isobaric, (6) two sub-processes (mixing/diffusion and elastic expansion of the polymer-solvent), and (7) polymer and solvent incompressible. The mixing/diffusion process model was largely based on Flory's model whereas for the elasticity model, a simple mechanical model was developed.
The mixing/diffusion process is a entropy-generating run-down process, and its effect on the gel swelling is to change the chemical potential of gel's interstitial solvent fluid. As evident in bond graph representation, this process is modeled by a resistance field driven by solvent's chemical potential difference across the gel's control volume boundary. The parameter to be estimated in the mixing/diffusion process model is the polymer-solvent interaction parameter, c. Estimation of c in general is difficult, but fortunately, extensive research have already been done to obtain c for PVA, and for simplicity, we estimated the c for PVA-PAA to be equal to that of PVA.
Theory of rubber elasticity of swelling gel has been already developed by Flory based on complex statistical theory. However, this theory still offered only a qualitative approximation, mainly due to the assumption that end-to-end distances of the chains can be described by a Gaussian distribution. In addition, parameters such as effective number of chains in the gel network are difficult to obtain. Given the complexity and limitation, I have decided that the Flory's rubber elasticity model was not appropriate as an actuator design/control model, and thus developed an alternative elasticity model based on a simple mechanical analog. In this model, the gel was modeled to be consisted of elastomer units aligned in principal axes and the interstitial solvent. The elastomer units were assumed to maintain constant volume, and the deformation in each axis were coupled to the other axes by Poisson effect at the intersecting joints. General elasticity theory was applied to the elastomer unit, and the resulting parameters to be estimated were the elastomer unit's' elastic modulus, Ed, and the "Poisson-like" ratio, n. Only the uniaxial tension in x-axis was considered, and according to the model, the net effect of the rubber elasticity on the gel swelling is to change the osmotic pressure (and therefore the chemical potential) of the interstitial solvent.
The effects of the mixing/diffusion process and the rubber elasticity were then combined to predict the chemical potential of the interstitial solvent, and the solvent flow into the gel was modeled as the fluid flow through restrictive porous matrix of gel's polymer network driven by solvent's chemical potential difference across the gel's boundary. The gel swelling kinetic model's permeability coefficient was obtained by employing Darcy's law and Happel and Brenner model.
Electrolyte gel model
In addition to the modeling assumptions for the non-electrolyte gel model, we also assumed: (1) the characteristic length of gel element is much greater than the Debye length, (2) ionic concentrations inside the gel are uniform at any instant of time, and (3) ions behave as in ideal dilute solution; ![]() where mi,e is the electrochemical potential, xi,g is the mole fraction, zi is the valence and fi,g is the electrical potential of the ion i inside the gel. The ions inside the gel were considered to have two effects; chemical capacitances and electric potential capacitances. The chemical capacitance model was based on the ideal dilute solution assumption, and the electric potential capacitance model was consisted of bulk electroneutrality and macroscopic electric potential gradient effects. By combining the chemical capacitance and the electric potential capacitances effects, the electro-chemical potential of ions were computed, and the transport of ions across the gel's boundary was modeled to be driven by the ion's electro-chemical potential gradient.
where mi,e is the electrochemical potential, xi,g is the mole fraction, zi is the valence and fi,g is the electrical potential of the ion i inside the gel. The ions inside the gel were considered to have two effects; chemical capacitances and electric potential capacitances. The chemical capacitance model was based on the ideal dilute solution assumption, and the electric potential capacitance model was consisted of bulk electroneutrality and macroscopic electric potential gradient effects. By combining the chemical capacitance and the electric potential capacitances effects, the electro-chemical potential of ions were computed, and the transport of ions across the gel's boundary was modeled to be driven by the ion's electro-chemical potential gradient.
In addition to the ion transport model, the ion's diffusion-limited reaction model was developed. As the ion moves into the gel network, it may also react with the fixed charges of the network, and such is the case for the PVA-PAA gel's swelling process where the diffusion hydronium ion, H3O+, can react with the carboxylic side group attached to the polymer network. It has been shown that such diffusion-limited reaction can significantly slow down the overall ion transport process. Although the chemical reaction has its own kinetics, we assumed that the reaction rate is almost instantaneous in comparison to the diffusion rate, and therefore it is assumed to be always at equilibrium.
The chemical and electrical capacitances, diffusion-limited reaction and ion transport kinetic models were then combined with the non-electrolyte model to arrive at the electrolyte gel model, and the result was then applied to the simplest case of binary electrolyte solution case for the purpose of illustration. Since the gel's interface region, which is only a few Debye length thick from the surface, reaches the equilibrium state almost instantaneously while the inner bulk regions equilibrated at much slower rates, the equilibrium states of the interface region were treated as the boundary conditions for the bulk unit.
Equilibrium swelling model verification
In order to verify the electrolyte gel model, PVA-PAA gel in acetate buffer bath solution was used. Since the application of the electrolyte gel model requires three volume ration dependent parameters (elastic modulus, Ed, "Poisson-like" ratio, n, and the polymer-solvent interaction parameter, c) to be estimated, the constant tension tests were first performed on a thin PVA-PAA gel film with tensile load of 6.098 x 10⁻² N, and the using the results, the PVA-PAA gel's parameters were estimated numerically. The resulting model with estimated parameters were then applied to the free swelling situation as well as to the situations where the tensile forces were of 6.098 x 10⁻² N and of 8.528 x 10⁻² N, and the predicted values of length ratios were compared to the actual experimental results. In addition, the model was also applied to the NaCl salt content test situations, and the predicted values were compared to the experimental results. In both cases, the model successfully predicted the PVA-PAA gel's actual behavior.
Swelling kinetic model verification
The PVA-PAA gel swelling rate can be limited by either the ion diffusion process or the mechanical readjustment process. In order to identify the limiting process, the incremental pH reduction test and the stress relaxation tests at various degrees of bath pH were performed, and the mechanical readjustment process was found to be the gel swelling's limiting process regardless of the bath pH. This allowed us to simply the gel's dynamic model to a first order coupled equation, and the resulting dynamic model was then simulated for the incremental pH reduction and the stress relaxation test situations. Furthermore, the gel's dimensional effect on the model prediction was investigated, and in both cases, the simulations successfully predicted the actual behaviors.
Implementation
For the purpose of demonstrating the PVA-PAA gel's model in real-time control, the computer controlled prototype actuator and supporting devices were built and experimentally tested. Although a model based feedback closed-loop controller would improve the system's performance, only the feed forward controller without any error compensation was used to demonstrate the performance due to the model only. Starting at fully swollen state in the acetate buffer solution of pH 7, the controller was commanded to track the PVA-PAA gel strip's desired axial length ratios, and during the course of the experiment, the tensile load was randomly changed at various points in time by hanging different weights and the controller was command to make necessary adjustment. Despite of wide range of external disturbance and lack of feed-back closed-loop control implementation, the system yielded excellent desired position tracking ability. Overall, the results were highly satisfactory, and clearly demonstrated the value of the lumped parameter model of electrolyte gel.
6.2 Contributions
In this thesis, I have fulfilled the goal of developing the lumped parameter model of polymer gel that is simple enough for a real-time control, yet able to capture the essential static and dynamic behavior of gel swelling by incorporating the essential electro-chemo-mechanical energy coupling. Using estimated parameters, the gel model was able to predict the gel's swelling behavior accurately, and the model was useful even in abnormal conditions such as high saline content. In addition to the control implementation, this simple model is also suitable for a practical actuator design where one may want to see quickly how the gel system would respond to changes in mechanical design parameters. Furthermore, I also have demonstrated how one may implement the resulting model in an actuator system based on polymer gel, where the controller successfully tracked the desired length ratios even in the presence of significant external disturbances. In addition, preliminary investigation of gel based actuator system design issues such as irrigation, force transmission and actuation geometries were conducted and described in Appendix A.
6.3 Future
We now have a simple, yet effective dynamic model for polymer gel to help us in both design and control of practical actuator, as demonstrated in this thesis, we are able to perform desired position tracking even without a closed-loop feedback controller. However, this is just a beginning toward the realization of a practical "artificial muscle" actuator, and many areas essential to practical actuator remain. As mentioned before, some of these areas include structure and packaging method, stimulation method, force transmission method, energy storage system and power delivery technique, and every one of these areas are necessary in developing a practical polymer gel actuator.
However, even before we jump into one of these areas, the most immediate next step in our future research would be to produce a polymer gel material that possesses both good mechanical property and controllability. For instance, as I have mentioned in the beginning, I have selected the PVA-PAA gel material for its controllability as well as the availability of information. Not only was the PVA-PAA gel easy to prepare in a typical laboratory setting, it also possesses a continuous swelling behavior with respect to the bath pH. However, as far as the mechanical property is concerned, it not adequate for practical actuator. Its strength and durability are simply too low. On the other hand, polymer gel materials such as poly(acrylonitrile) (PAN) demonstrate rapid contraction rates together with high intrinsic strength and durability, a perfect material for this application. However, it is not without its own problem: PAN gel is a amphoteric (bipolar) gel, and as a result, exhibits severe hyteresis in swelling behavior. For instance, the bath pH has to increase to a high degree before the gel abruptly swells, and conversely, the pH has to decrease to a very low value before the gel contracts. Not only does it make the system highly inefficient, position control of such system would be extremely difficult.
It would be ideal to have a gel material with the controllability of PVA-PAA and the mechanical properties of PAN. This is the area we would like to pursue as the next step in our research, and currently are looking into the possibility of converting the PAN gel into a unipolar gel as PVA. As a result of this conversion, we hope to produce a polymer gel material that possesses continuous swelling behavior while maintaining good mechanical properties.
APPENDIX A
Actuator system design
The design of a practical polymer gel actuator requires consideration not only of the material, but also of the supporting mechanics, stimulation method, energy storage system, power delivery technique, packaging method, dynamic model and control system. In this appendix, we describe the design of two complete, self-contained gel based linear actuators. These actuators were constructed with an array of pH sensitive gel fibers together with a integral fluid irrigation system. The gel fibers, prepared from commercially available poly(acrylonitrile) (PAN) filaments, demonstrate rapid contraction rates together with high intrinsic strength. The irrigation system for each actuator was designed to rapidly and simultaneously control the pH throughout the fiber array. Although there are many possible stimulation methods, we focused on the regulation of pH since this produces rapid phase changes in the gel, as well as provides intrinsic chemical energy storage. Techniques for locally and rapidly regulating solvent composition may also serve as a model for other fluidic stimulation systems.
A.1 Materials and methods
In this section, we describe two linear actuators based on pH stimulation of PAN gel fiber arrays using an integral fluid irrigation system. The first system used a cylindrical design with gel fiber bundles distributed evenly among an array of irrigating Teflon tubes. The second, based on the results from the first system, used a planar array of gel fibers positioned between two fluid reservoirs containing acid and base respectively.
A.1.1 Cylindrical actuator
The initial actuation system consisted of a cylindrical polymer gel actuator, mechanical linkage, single stage cable transmission, optical joint position sensor, tendon force gauge, passive antagonistic spring, and two servo controlled valves, as illustrated in Figure A.1. The sensors and servo valves were interfaced to the computer, as shown in Figure A.2. Designed with low friction and inertia, the system included a modular pulley system for variable transmission ratios. Acid and base were alternatively delivered to the gel fiber bundles through an array of perforated Teflon tubes, as shown in Figure A.3.

Figure A.1: Schematic diagram of the cylindrical gel actuation system. The apparatus was composed of a single mechanical joint, single stage cable driven transmission, passive antagonist spring, optical joint position sensor, tendon force gauges, and servo controlled valves.
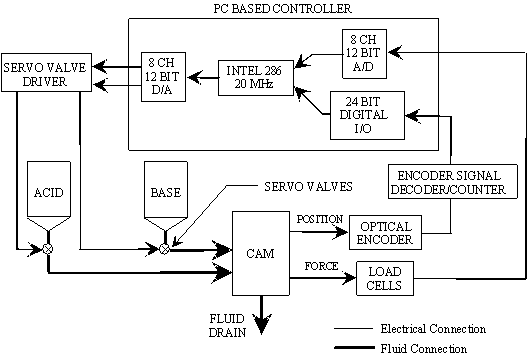
Figure A.2: Schematic diagram of the control system.
Gel fiber bundles were prepared from commercially available PAN fibers (Mitsubishi Rayon Co., Ltd., Silpalon 2000/600, 2000 filaments, single filament diameter: 10mm). The PAN fibers were first annealed at 210 C in air for five hours. Four lengths of the annealed fibers were epoxied to Spectra tendon (high-molecular weight poly(ethylene), Spectra 1000, Cortland Cable Co., Inc.). The mid section of the bundles were then saponified in boiling 1M NaOH aqueous solution for 30 minutes. Only the middle section was saponified to prevent swelling and rupture at the rigid, epoxied terminations. In addition, the variation of the NaOH fluid level during boiling produced a continuous region of active to inactive PAN fiber, creating a smooth stress gradient from swollen gel to fixed termination, thus reducing fatigue life failure. The gel bundles with Spectra tendons were attached to a stationary fixture on one end of the cylinder and a sliding plate on the other, as shown in Figure A.3. Teflon tubes (1.20 mm O.D., 0.80 mm I.D.) were perforated with small holes at 1 mm spacing to serve as the irrigation system. Originally porous Teflon tubing was used for this purpose, however the small effective pore size restricted fluid flow. Also, the high exit velocity afforded by the punctured holes produced turbulent mixing and a more rapid response time. Finally, the irrigation tubes were connected to a fluid manifold, allowing the acid and base lines to be controlled by two servo valves.
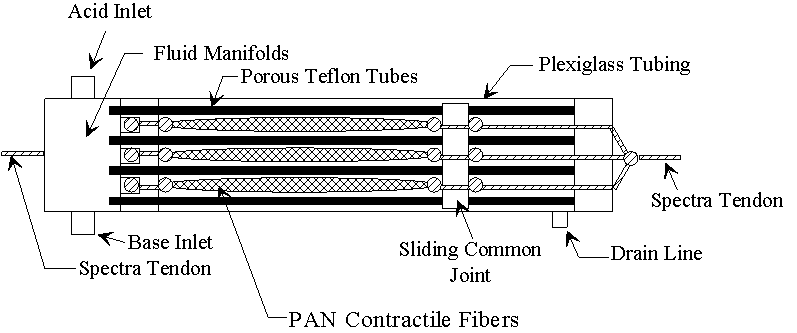
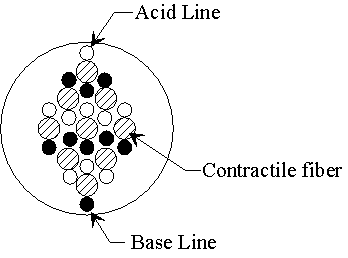
Figure A.3: Schematic diagram of the cylindrical polymer gel actuator using PAN gel fibers. Perforated Teflon irrigation tubes were connected to a common fluid manifold allowing only two input lines from the fluid control valves. The distribution of tubes among the fibers attempted to minimize fluid diffusion time to maximize overall actuator performance. The second view shows the arrangement of gel fiber bundles, and acid and base conduits in cross section.
A.1.2 Planar actuator
Based on the results from the first actuator, a second was constructed, which consisted of a planar array of PAN gel fibers situated between two fluid reservoirs containing acid and base respectively, as shown in Figure A.4. Two perforated sheets separated the fluid reservoirs from the fiber array, and allowed a controllable simultaneous infusion of fluid onto gel fibers. An additional fluid line into the fiber chamber provided a continuous flow of neutral solution through the fibers to flush particulate buildup. A common mechanical coupling was constructed to transmit and balance loads from individual fiber bundles. This also prevented cascading fiber failure and simplified analysis by providing equal fiber loading. The mechanical coupling was connected to an instrumented pulley allowing force and position measurement. Acid, base, and neutral lines were regulated using computer controlled serve valves.
A.1.3 Fluid irrigation system model
In this section, we describe the analytic model of the planar actuator's fluid irrigation system. A schematic diagram of the planar actuator is shown in Figure A.5. Fluid flow was modeled using a lumped parameter approach in which individual subunits were assumed identically except for the boundary conditions.
An individual actuator subunit, shown schematically in Figure A.6, consists of five sections: 1) the acid/base (a/b) orifice flow region, 2) a/b entrance region, 3) a/b parallel plate region, 4) water/salt (w/s) mixing region, and 5) w/s parallel plate region.
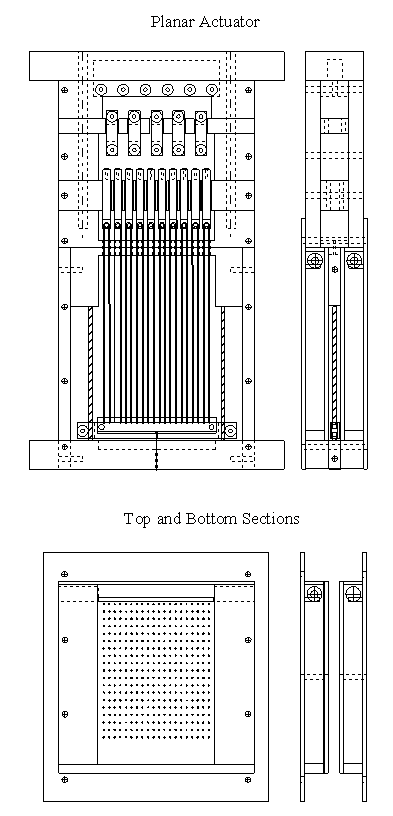
Figure A.4: A planar array of PAN gel fibers was positioned between two reservoirs containing acid and base respectively. The reservoirs could alternatively flood chamber simultaneously through perforated sheets. A common mechanical coupling transmitted and balanced the loads from the individual fiber bundles.
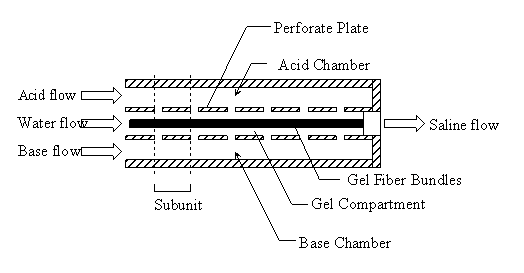
Figure A.5: Schematic diagram of the planar actuator.
Flow through the orifice was modeled as an inviscid flow with correction factor Cd. We assumed flow through a hypothetical surface of area Ain within region 2 entered a pore with area Ap. This produces the following equation for flow through the pore,

where I is the fluid inertia

where lin is the characteristic length of fluid travel in region 2, and lp is the length of the orifice. We assumed Ain>>Ap, and lin>>lp, thus the flow could be described by

Note that the fluid inertia term is still significant due to the relatively small Ap.
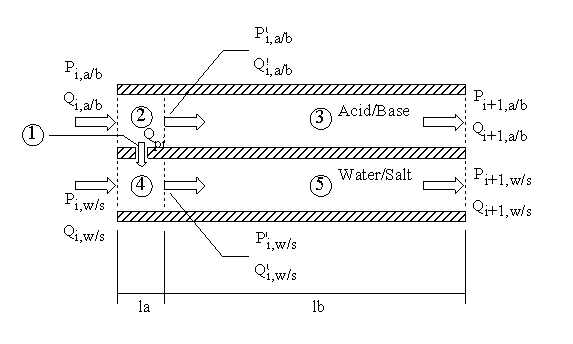
Figure A.6: Schematic diagram of an irrigation subunit.
We assumed that the flow through region 2 toward region 3 was inviscid, and that the inertia was negligible, since la<<lb. Thus the flow through region 2 is described by
![]()
where A is the cross sectional area of fluid flow.
Unlike the flow through region 2, flow through region 4 could not be modeled as inviscid since the incoming orifice flow causes turbulent mixing. We therefore used a control volume approach. The force applied to the control volume is related to the momentum flux of flow by the expression
![]()
where ![]() is the fluid velocity. Assuming the fluid-wall shear force is negligible, we have
is the fluid velocity. Assuming the fluid-wall shear force is negligible, we have
![]()
where ![]() is the average fluid velocity. Since the fluid is incompressible,
is the average fluid velocity. Since the fluid is incompressible, ![]() A is equal to the flow rate Q. Thus
A is equal to the flow rate Q. Thus

Make the conventional assumptions about parallel plate flow, the Navier-Stokes equation simplified to

Assuming
![]() and
and ![]()
the average fluid velocity along the parallel plate in the x direction is described by

Since the fluid is incompressible, ![]() , and
, and

Mass conservation integrates each flow region with
![]()
![]()
The flow from the fluid reservoirs to the actuator inlet ports, and from the actuator outlet ports to the drain were also modeled as inviscid. These flows are described by
![]()
for the inlet ports and

for the outlet port, where PL, PH, Patm are the inlet, outlet, and ambient pressures respectively, and QI and QO are the inlet and outlet flow rates. The variables AL is the fluid line cross section area, and ACH is the cross sectional area of the actuator fluid chamber. Note QI and QO are related to the subunit flows by QI = nQ1 and QO = nQL, where n is the number of gel fiber bundles. By conservation of linear momentum,

Given the flow rates Qi,w/s, Qp,i, and Qi+1,w/s of the mixing compartment, the hydronium ion concentration of the gel compartment is

where Vc is the volume of the gel compartment subunit. The hydroxide ion from base was treated as -[H3O+]. We assumed complete dissociation of strong acid/base, though the self dissociation of water needs to be considered near neutral conditions.
A.2 Results and discussion
A.2.1 Cylindrical actuator
The performance of the cylindrical actuator is shown in Figure A.7. Using a simple bang-bang control scheme, the arm rotated from zero to 170 degrees and back in approximately 45 seconds, generating a maximum tendon tension of 0.35 N. Although the cylindrical design achieved our goal of a complete, self-contained polymer gel actuator, there were a number of areas in which performance was improved in the subsequent design. First, the irrigation scheme was not optimal in that fluid from the upper tubing flowed over the lower fibers, thus wasting fluid in the lower region. In the planar design, fluid traveled along the length of the fiber, optimizing the use of the solution. Second, the swollen fibers in the cylindrical actuator pressed against the adjacent tubes, thus blocking the pores. In this state, fluid flowed only from the extreme ends of the irrigating tubes, which delayed the onset of contraction. The planar design separated the fiber bundles from each other and from the inlet pores. Third, uneven fiber loading resulting from differential phase change across the array, creating unwanted side loading on the transmission, as well as reducing fiber fatigue life. In the subsequent design, a mechanical transmission was added to equalize the force across the fiber array. Fourth, particulate buildup from the acid/base reaction impeded fiber mobility. The planar actuator provided a continuous neutral flow through the fiber region to flush the reaction products. Finally, the planar system provided a simpler and more consistent system for mechanical modeling.
A.2.2 Planar actuator
In this section, we present and discuss the results of the planar actuator simulation and experimental data. Simulated pore flow rate Qp and hydronium ion concentration cH for individual actuator subunits is shown in Figure A.8. Identical pore diameters were initially used to produce identical orifice flow rates; however the hydronium ion concentration varied in the fiber chamber, as fluid from upstream pores mixed with fluid in downstream regions. A more uniform pH gradient was produced by decreasing the hole size along the flow direction. This produced uneven orifice flow rates, but more homogeneous hydronium ion concentration, as shown in Figure A.8.
Experimental data from the planar actuator are shown in Figure A.9. The response time of the actual system was far slower than the simulated pH environment, as shown in Figure A.8. Given that the pH environment changes an order of magnitude faster than the experimental system, and that the individual fibril response time is on the order of 0.1 to 0.2 seconds, it appears the fiber bundle under tension impedes diffusion of its interior members, and that further actuator improvement requires separation of the individual fibrils. Future work will therefore be directed toward individual fiber actuation systems, as well as mechanical designs which more quickly irrigate throughout the fiber bundle.
A.3 Conclusion
In this section, we described the design and construction of two polymer gel actuation systems based on the irrigation of gel fiber arrays using acid and base solutions. A dynamic model of a planar acutator's irrigation system was presented. Although actuator response time was improved by more careful attention to irrigation flow, balanced gel loading, and fiber bundle separation, initial results suggest further improvement may be realized by individual fibril irrigation.
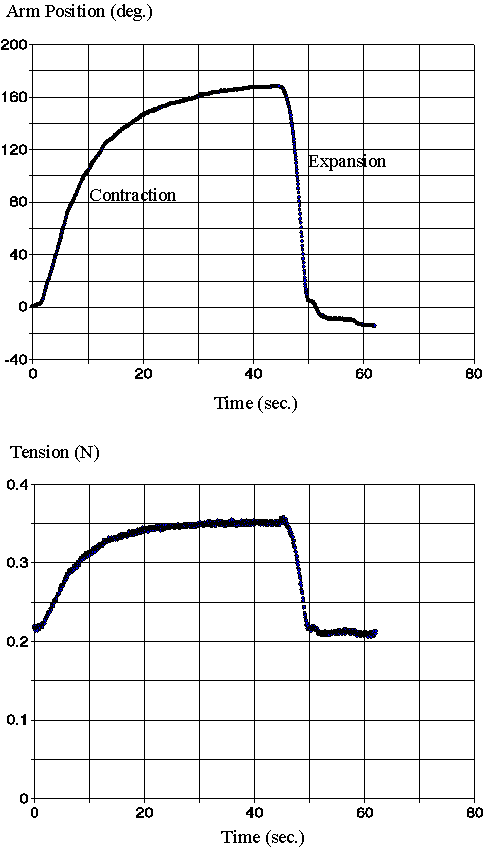
Figure A.7: Contraction and expansion is shown using a passive spring as an antagonistic element. The arm rotated from zero to 170 degrees and back with the maximum tendon tension of 0.35 N. Maximum arm speed during contraction was approximately 16 degree per second.
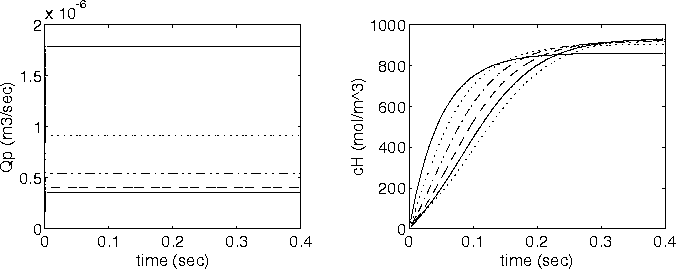
Figure A.8: Decreasing orifice diameters produce more a uniform hydronium ion concentration along the fiber. Different line types are used to present flow and ion concentration for the six different actuator subunits. In order upper to lower subunits in the fluid flow direction: _, ..., _._,---,_, and ... .
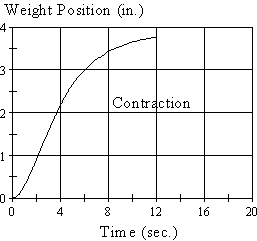
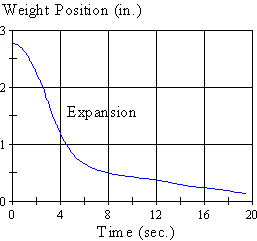
Figure A.9: Contraction and expansion response times are improved with the planar actuator.
APPENDIX B
PAN gel fiber mechanical testing
B.1 Introduction
Polyacrylonitrile (PAN) gel fibers have been shown to shrink and swell reversibly under acidic and alkaline conditions respectively (Chiarelli 1989, Umemoto 1991). They were selected for the actuator designs discussed in Appendix A because they were reported to possess good mechanical property, the fabrication process was well documented (Chiarelli 1989) and most importantly they were commercially available. By studying PAN we can develop an understanding of the influence of preparation techniques on materials properties and a method of testing which can be used in developing and customizing future actuator materials.
B.2 Materials Testing
PAN gel fibers were prepared from commercially available PAN fibers by first annealing at high temperature to induce crosslinking and then saponifying in 1 M NaOH to produce carboxylic groups for the original nitrile groups. This ionic gel then swells in basic and contracts in acidic solutions. The mechanical properties of the PAN polymer hydrogel are strongly dependent on the degree of crosslinking, and since the PAN fibers are thermally crosslinked, their mechanical properties will depend on both the curing temperature and time. To determine the effect of crosslinking and the curing procedure on the tensile strength and elastic modulus , we conducted a series of mechanical measurements on material cured for 2,3,4 and 5 hours at 175° , 180° , 190° , 200° and 210° C.
B.2.1 Apparatus
A tensile testing apparatus (Figure B.1) was constructed to test individual fibers and fiber bundles. It consists of a support structure, linear stage, loadcell, test chamber, associated electronics and computer. The support structure was constructed from 6061-T351 2''X2'' Aluminum bar stock and 1/2'' plate. Mounted on the horizontal member are two Daedelus linear stages (stage: 1'' travel .001'' readable increment). The fibers were manually stretched by 0.001" increments using the linear stages, followed each time by computer recording of force measurement. The outer linear stage secured the strain gauge based loadcell. The loadcell is constructed from a single piece of 6061-T351 aluminum and contains four N3K-13-S024F-50C 5kW strain gauges (Micro-Measurements, Inc.) which comprise a full bridge circuit. The loadcell was connected to amplifying electronics and the output voltages were sent through a DAS-16 (16-bit, 10MHz) A/D converter (MetraByte, Inc.) which was plugged into a 20MHz 286 IBM compatible computer. To collect data from the sensors, two data acquisition programs were written which utilized the DAS-16 card and the output of the load cell. The first calculated the forces generated. This program was used to measure the tensile strength of the gels. As the gel was stretched, force measurements were taken at regular intervals. The second program was used in measuring the reaction times of the gels. The program automatically took force measurements at regular time intervals.
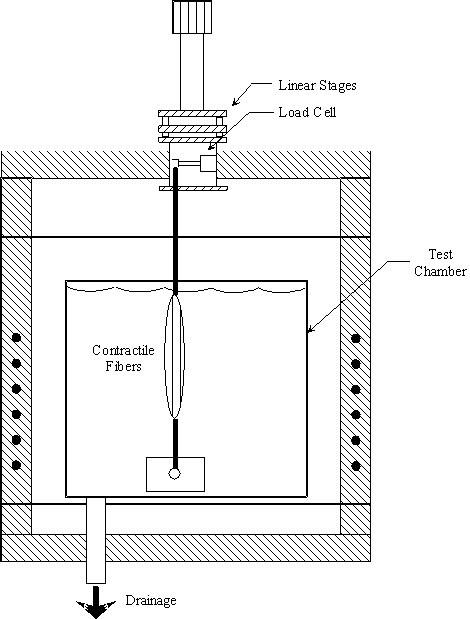
Figure B.1: The mechanical testing apparatus was used to develop force/length curves, yield strength, contraction/expansion time, and length change.
B.2.2 Sample preparation
PAN gel fibers were prepared by preoxidation and saponification (as described in Chiarelli 1987). Commercially available PAN fibers (Mitsubishi Rayon Co., Ltd., Silpalon 2000/600, 2000 filaments single filament diameter: 10.0m m) were annealed for 2, 3, 4 and 5 hours at 175° , 180° , 190° , 200° and 210° C in air at constant length. Four equal lengths of PAN fiber were epoxied to a woven polyethylene tendon (Braided Spectra 1000 Line 8 BS10/8x375 - 150 lb, Corralled Cable Company, Inc.). The middle portion of the PAN fiber bundle was boiled in 1N NaOH aqueous solution for 30 min. This procedure allowed the saponification of the PAN fibers while avoiding gelatination at the epoxy terminations, which would have otherwise caused large stress gradients and therefore breakage.
B.2.3 Materials Testing Procedures
To determine the tensile force, the gels were attached to the mounting point of the load cell and the anchor at the base of the chamber. After a measurement of the length of the gel using a scale, the chamber was filled with acid or base. The linear stages were then incremented until the gel broke. The increment was recorded to determine the percent elongation of the gel before breaking.
To determine the stiffness, a gel in the relaxed state was mounted and stretched with the linear stages (as long as the gel was not broken, the degree of stretching did not matter). The length of the gel was then recorded. The data acquisition program was activated and the gel was flushed with acid. After the gel was fully contracted, the acquisition program was stopped and the length of the gel was recorded.
Samples were either contracted in an acidic solution, pH 1 or dilated in an alkaline solution, pH 13, before testing. For each annealing time and temperature, two tests were conducted, one swollen and one contracted. Each sample was initially fixed in the apparatus at rest length and then tensioned incrementally every 0.64 mm (0.025 in). The force was recorded at each increment until the sample ruptured. An example of one such trial is shown in Figure B.2.
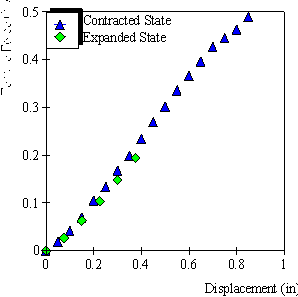
Figure B.2: Elongation and tensile strength of an 8000 filament bundle (10 micron diameter filaments) cured at 190 ° for 3 hours, where o represents the contracted state and O the expanded. The last data point represents breaking point of the sample.
B.2.4 Materials Testing Results
One sample for each annealing time and temperature combination was tested (20 samples in total). One experiment was conducted on each sample and the tensile strength and stiffness was estimated from the resulting curve. The graphs in Figure B.3 show the ultimate tensile force (i.e. the largest force recorded for each trial) for each sample in both the swollen state, Figure B.3a, and contracted state, Figure B.3b. The stiffness for the composite samples, as calculated from the force/length data, is shown in Figure B.4. Calculation of elastic modulus of the gel requires the knowledge of gel's cross sectional area, and due to lack of adequate method of measurement, we have not attempted to translate the stiffness data into elastic modulus data.
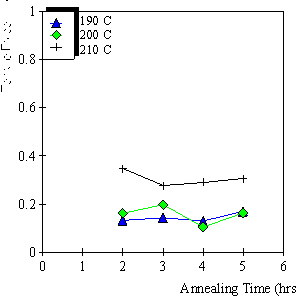
a - Swollen State
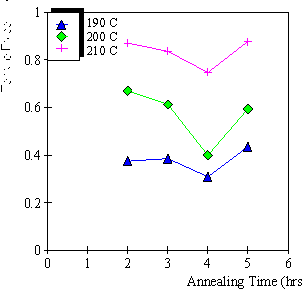
b - Contracted State
Figure B.3: The ultimate tensile force necessary to break the samples in the swollen state is shown in the first figure and in the contracted state in the second. Samples annealed below 190° C did not have sufficient structural integrity to undergo testing. The symbol O represents 190° C,o 200° C and + 210° C.
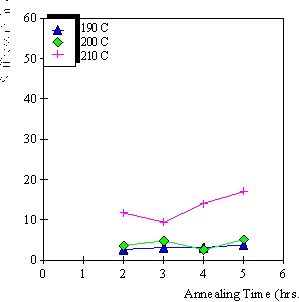
a - Swollen State
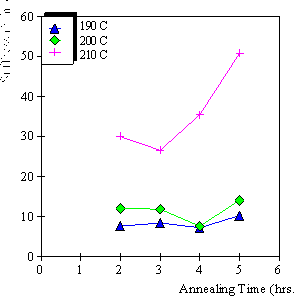
b - Contracted State
Figure B.4: The stiffness of the composite samples is shown above for both the swollen and contracted state. The symbol O represents 190° C, o 200° C and + 210° C.
B.3 Discussion
Clearly the degree of crosslinking due the preoxidation thermal annealing has a great effect on the mechanical properties of the PAN gel fibers. The strength and stiffness improved with both time and temperature. This suggested that even stronger and faster activating fibers can be produced with higher temperatures and longer annealing times. In addition it is interesting to note that the stiffness of the gel in these experiments did not vary much between the contracted and expanded states, especially at low crosslinked state.
REFERENCES
Bejczy, A.K. And Salisbury, J.K., "Controlling Remote Manipulators Through Kinesthetic Coupling," Computers in Mechanical Engineering, July 1983
Brock, David, ``Artificial Muscles,'' MIT AI Memo, in press, 1991A.
Brock, D., Lee, W., Segalman, D., Witkowski, W., "A Dynamic Model of a Linear Actuator Based on Polymer Hydrogel," Journal of Intelligent Material Systems and Structures, Vol. 5, No. 6, 764-771, 1994.
Caldwell, D. and Taylor, P., Hull University, 1990.
Chiarelli, P. and De Rossi, D., "Determination of Mechanical Parameters related to the Kinetics of Swelling in an Electrically Activated Contractile Gel," Progress in Colloid and Polymer Science, Vol. 48, 1988.
Chiarelli, P., De Rossi, D., and Umezawa, K., "Progress in the Design of an Artificial Urethral Sphincter,'' Proc. of the 3rd Vienna International Workshop on Functional Electrostimulation}, Vienna Austria, Sept. 1989.
Chiarelli, et. al., ``Progress in the Design of an Artificial Urethral Sphincter,'' Proc. of the 3rd Vienna International Workshop on Functional Electrostimulation, Vienna Austria, Sept. 1989.
De Rossi, et. al., ``Contractile Behavior of Electrically Activated Mechanochemical Polymer Actuators,'' Transactions of the American Society of Artificial Internal Organs XXXII, p. 157-162, 1986.
Flory, P. J., Principles of Polymer Chemistry, Cornell University Press, Ithaca, New York, 1990.
Grimshaw, P., et. al., ``Dynamic Membranes for Protein Transport: Chemical Electrical Control,'' Chemical Engineering Science, Vol. 44, No. 4, 1989, pp. 827-840.
Grimshaw, P., et. al., ``Selective Augmentation of Macromolecular Transport in Gels by Electrodiffusion and Electrokinetics,'' Chemical Engineering Science, Vol. 45, No. 9, 1990, pp. 2917-2929.
Grimshaw, P. E., Nussbaum, J. H., Grodzinsky, A. J., Yarmush, M. L., "Kinetics of electrically and chemically induced swelling in polyelectrolyte gels," Journal of Chemical Physics, Vol. 93, No. 6, 4462-4472, 1990.
Grodzinsky, A. J., Fields, Forces and Flows in Biological Tissues and Membranes, lecture notes.
Genuini, G., et. al., "Psuedomuscular Linear Actuators: Modeling and Simulation Experiences in the Motion of Articulated Chains," In Press, NATO ACI Science, 1990.
Hamlem, R. P., Kent, C. E., and Shafer, S. N., ``Electrolytically Active Polymers,'' Nature, Vol. 206, p. 1149-1150, 1965.
Happel, J. and Brenner, Low Reynolds Number Hydrodynamics, p. 393, Prentice Hall Publisher, Englewood Cliffs, NJ., 1973.
Hess, C. and Li, L., "Smart Hands for EVA Retriever," NASA Conference on Space Telerobotics, January 1989, Pasadena, CA
Hirotsu, S., Hirokawa, Y. and Tanaka, T., ``Volume-phase transitions of ionized N-isopropylacrylamide gels,'' Journal of Chemical Physics, Vol. 87, No. 2, p. 1392-1395, 1987.
Katayama, S., Hirokawa Y. and Tanaka, T., ``Reentrant Phase Transitions Acrylamide Derived Gels,'' Macromolecules, 1984.
Kokufata, E., Zhang, Y., and Tanaka, T., ``Saccharide-sensitive Phase Transition of a Lectin-loaded Gel,'' Nature, Vol. 351, May 23, 1991, pp. 302-304.
Kuhn, W., et. al., "Reversible Dilatation and Contraction by Changing the State of Ionization of High-polymer Acid Networks," Nature, Vol. 165, p. 514-516, 1950.
Kokufata, E., Zhang, Y., and Tanaka, T., "Saccharide-sensitive phase transition of a lectin-loaded gel," Nature, Vol. 351, p. 302-304, May 1991.
Li, Y. and Tanaka, T., "Study of the Universality Class of the Gel Network System," Journal of Chemical Physics, Vol. 90, No. 9, p. 5161-5166, 1989.
Jacobsen, S.C., Iverson, E.K., Knutti, D.F., Johnson, R.T. And Biggers, K.B., "Design of the UTAH/M.I.T. Dexterous Hand," IEEE International Conference on Robotics and Automation, April 1986, San Francisco, CA
Jacobsen, S.C., "The State of the Art in Dexterous Robotics," Conference Dinner Speaker, IEEE International Conference on Robotics and Automation, May 1989, Scottsdale, AZ
Matsuo, Eriko Sato and Tanaka, Toyoichi, ``Kinetics of discontinuous volume-phase transition of gels'', Journal of Chemical Physics, Vol. 89, No. 3, 1988.
Nagasawa, M., ``Molecular Conformation and Dynamics of Macromolecules in Condensed Systems," Studies in Polymer Science, Elsevier, New York, 1988.
Nicoli, D., et. al., ``Chemical Modification of Acrylamide Gels: Verification of the Role of Ionization in Phase Transitions,'' Macromolecules, Vol. 16, p. 887-891, 1983.
Ogston, A. G., Preston, B. N., Wells, J. D., Proc. R. Soc. London, 1973, 333, 297.
Ohmine, I. and Tanaka, T., ``Salt Effects on the Phase Transitions of Polymer Gels," Journal of Chemical Physics, Vol. 77, p. 5725, 1982.
Osada, T. and Hasebe, M., ``Electrically Actuated Mechanochemical Devices using Polyelectrolyte Gels,'' Chemistry Letters, p. 1285-1288, 1985.
Oster, G., Auslander, D., "Topological Representations of Thermodynamic System-II. Some Elemental Subunits for Irreversible Thermodynamics," Journal of Franklin Institute, 77-92, 1971.
Sakurada, I., et. al., "Vapor Pressures of Polymer Solutions. II. Vapor Pressure of the Poly(vinyl Alcohol)-Water System," Vol. 35, 497-505, 1959.
Salisbury, J.K., "Design and Control of an Articulated Hand'" International Symposium of Design Synthesis, July 1984, Tokyo
Tanaka, T., "Gels'', Scientific American, p. 124-138, January 1981.
Tanaka, T., ``Collapse of Gels and the Critical Endpoint,'' Physical Review Letters, Vol. 40, p. 820, 1978.
Tanaka, T., et. al., ``Phase Transition in Ionic Gels,'' Physical Review Letters, Vol. 45, p. 1636, 1980.
Tanaka, T., ``Gels'', Scientific American, p. 124-138, January 1981.
Tanaka, T., Nishio, I., Sun, S.T., and Ueno-Nishio, S., ``Collapse of Gels under an Electric Field'', Science, Vol. 218, p. 467, 1982.
Tanaka, T., et. al., ``Mechanical instability of gels at the phase transition", Nature, Vol. 325, No. 6107, pp. 796-798, February 26, 1987.
Tanaka, T., ``Gels,'' Structure and Dynamics of Biopolymers, edited by Nicolini, C., Martinus Nijhoff Publishers, Boston, p. 237-257, 1987.
Umemoto, S., Okui, N., and Sakai, T., "Contraction Behavior of Poly(acrylonitrile) Gel Fibers,'' Polymer Gels Fundamentals and Biomedical Applications, Ed. De Rossi, D.,Plenum Press, New York, 1991, pp. 257-270.
Young, R. J., Lovell, P. A., Introduction to Polymers, 2nd. Edition, pg. 353, Chapman & Hall, London, 1991.
Zrinyi, M., Horkay, F., "On the Thermodynamics of Chemomechanical Energy Conversion Realised by Neutral Gels," Journal of Intelligent Material Systems and Structures, Vol. 4, 190-201, 1993.