

Minimizing the amount of overhead imposed by profiling is critically important for the clever compiler, since in the quasistatic computing model, the end-user (and not just the programmer) will always be subjected to that overhead.
How to instrument a program to extract performance information is a
major topic in its own right; I briefly describe the commonly
available profiling mechanisms available to C programmers on UNIX
platforms --- prof, gprof,
and pixie --- in Appendix
  . The
different techniques have their pros and cons, but generally speaking,
there's a tradeoff between the amount and accuracy of information
gathered, and the overhead incurred at program run-time. The
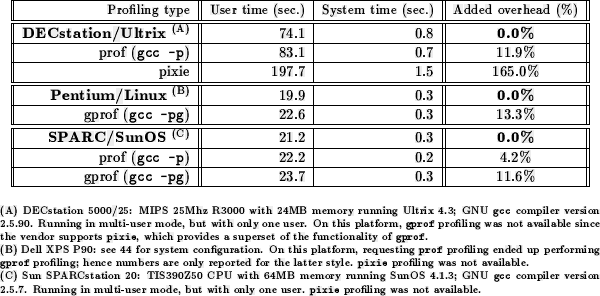
percentages shown in Table
  are in
accord with the ``common wisdom'' --- 5--10% for prof, 10--15%
for gprof, and 100--200% for pixie.
Note that the tremendously outsized amount of overhead for pixie is due to the fact that instrumenting every single basic block gathers far more information than is necessary most of the time. One way to keep overhead reasonable is to gather exactly what is needed to perform the desired performance analysis and no more; by building the static call graph beforehand, one can reduce the amount of instrumentation added to the program, and still gather a basis set of data that can be used to generate a full weighted call graph. [,] However, even the overhead required to gather such a basis set can still be improved upon: although these general-purpose tools cannot a priori predict what information the human programmer will be interested in, most of the time the human programmer doesn't really need to see the entire weighted call graph.... However, an user interface that allows the programmer to specify what profiling information is actually desired, thus potentially reducing the run-time overhead, has not been considered or implemented, to my knowledge; not surprising, since under the current paradigm for how these tools are used, even a several-fold performance hit may be acceptable if profiling is only turned on briefly to run the program against some small but hopefully representative sample of program inputs.

Table: Profiling overhead for eqntott run on the reference
SPECint92 input file.
Existing profiling mechanisms have several drawbacks when viewed in the light of their use by a smart compiler in a quasistatic computing environment. To minimize run-time overhead, the profiling mechanism should permit very selective instrumentation, at exactly the points of interest. None of the mechanisms mentioned up to this point make selective instrumentation easy.
In addition, the mentioned mechanisms all attempt to measure or
estimate CPU time spent executing the program; however, what the
typical user today really cares about is clock time, not CPU time (the
days of being charged by how many seconds of CPU time are used being
long past for most users). For example, in the load-balancing example
on page  , the goal of the clever
compiler should not be to choose the balancing which minimizes the
amount of local computation done, but rather the balancing which
minimizes the time that the user has to wait for the results of the
computation; otherwise, the quasistatic decision might end up always
pushing all the work to the remote servers, even though this might
make the user wait longer on average for the results of their
computation.
The UNIX system call gettimeofday() could in theory provide the
current clock time for profiling purposes; however, system calls are
relatively expensive, and hence
requiring that added instrumentation code perform a system call
implies potentially a substantial overhead. Furthermore, frequently
the granularity of the time value received back is inherently coarse
due to the representation type of the time value, and is not
guaranteed to be accurate even to the limit of the representation's
resolution.
However, a number of newer processor architectures make the real time
available to programs very inexpensively. For example, the new Intel
x86 RDTSC instruction , very briefly mentioned on page 10-8 and A-7
in the Pentium architecture manual [], and more throughly
discussed in [], is intended to provide a guaranteed
monotonically increasing timestamp, but happens to be implemented on
the Pentium as a count of the number of clock cycles elapsed since
power up. Similarly, SPARC Technology Business indicates in a white
paper
 that the UltraSPARC processor will have a similar feature:
However, using such timestamps to implement real-time stopwatches to profile program performance also has at least several major flaws. First, it introduces noise which would not be visible for profiling mechanisms attempting to measure CPU time spent executing the program. On a workstation running a multi-tasking operating system and possibly providing services to other machines on the network, the clock time a local-CPU-bound program takes to run to completion with identical inputs can easily fluctuate wildly, depending on other demands are being placed on the workstation. Fluctuations of an order of magnitude is not unheard of under generally heavy load conditions. Possible heuristics to deal with this and other sources of noise will be discussed later. Second, such timestamps are not yet available on most processors in use today, hence real-time profiling is not very portable.

Table: Gathering precise profiling data using RDTSC instruction.
Table  demonstrate the kind of information which
can be garnered using the RDTSC instruction on a Pentium (see
also the source code in Figure
  on
page
  ). Note that the real-time aspect
means that the cache effects of calling a function for the first time
as compared to later calls is easily visible; also, note that the
overhead of the profiling code itself is more than an order of
magnitude less than making system calls to get the current time, thus
making this technique more practical for instrumenting code than using
system calls to obtain the real time. Figure
  also uses three very useful features of the GNU gcc compiler
being used as the back-end for my modified compiler:
Because of these gcc features, I could write functions to start,
stop, and update a stopwatch counter mostly in C. To have a
particular region of code profiled, I merely had to (write SUIF
manipulation code to) bracket that region in the SUIF file with
``calls'' to qp_start() (start a stopwatch counter) and
qp_stop() (stop and update a stopwatch counter). The output of
s2c would then contain those function calls. However, when I then
compiled the output of s2c with gcc after including the
qprofiling.h header file with the inline-marked
definitions for qp_start() and qp_stop(), gcc would
take care of inlining the bodies of the functions wherever they were
called. (If inlining were not done, the overhead of profiling a
region of code would increase by 26 cycles, 13 cycles for each
function call.) This was much simpler than having to bracket
the region to be profiled with the bodies of qp_start() and
qp_stop() directly in the SUIF file, and made debugging the contents
of qp_start() and qp_stop() relatively
painless.
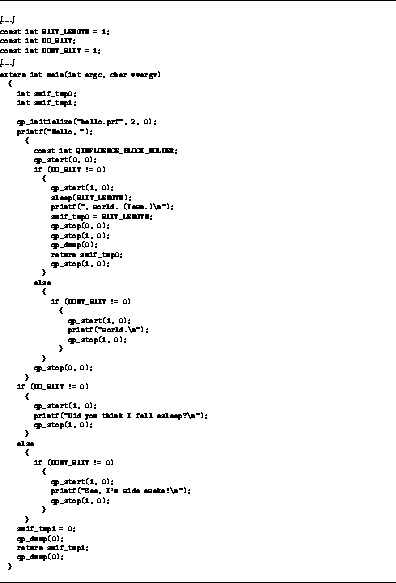
Writing the add_profiling compiler pass was not difficult, given qp_start() and qp_stop(). The pass walks the AST for each function, searching for annotations which indicate a qif or qinfluence statement, and then brackets the appropriate clauses with the profiling ``calls'' --- the integer UID created by the integrate pass for each set of interacting constructs is used in the calls to designate which stopwatch counter should be started and stopped. The add_profiling pass also modifies the main() function in the SUIF file to call the initialization routine qp_initialize() and the termination routine qp_dump(); the latter saved profiling information to a file in raw form (to be processed into meaningful format later), and is also responsible for re-invoking the clever compiler when enough profiling information has been accumulated.
One complication only discovered during implementation was non-linear
flow control; for example, a qinfluence statement's block may
contain longjmp() calls, exit() calls, goto,
continue, break, or return statements, any of which could
cause the qp_stop() call matching the entrance qp_start()
call to not be executed. Calls to exit() were particularly
problematic, since they would cause the qp_dump() routine not to
be executed, and no profiling information from the run would be
saved. The current add_profiling
pass has special handling for only one of these non-linear flow
control cases, the return statement, which I expected to be the
most commonly encountered. In principle, the others can be dealt with
similarly. A return statement which appears inside a qif
clause or qinfluence block of the form

is transformed into

The temporary is introduced so that if expression would take a
long time to evaluate, the time spent would continue to be
stopwatched. Any return statements in the main() function
are similarly transformed to ensure that qp_dump() is called
before program termination. See Figures  and
and  .
.

Figure: hello.c after being processed by integrate,
add_profiling, and select_alternatives passes.


